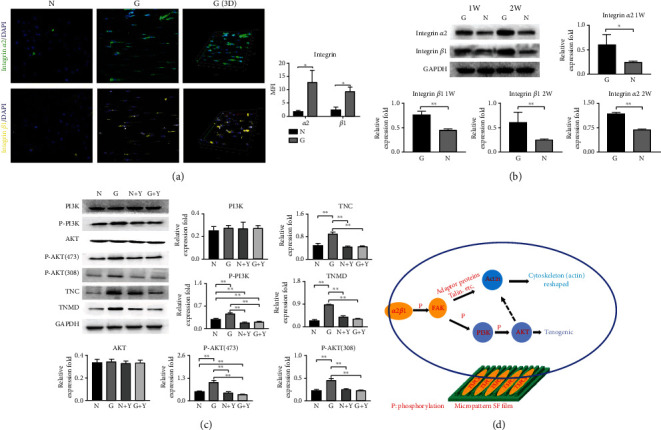
Figure 5.

Validation of key proteins in signaling pathways. (a) Immunofluorescence results of α2β1. The expression level of Group G was significantly higher than that of group N. (b) Western blot analysis of integrin α2β1. α2β1 was significantly increased in Group G. (c) Western blot analysis of the PI3K/AKT signaling pathway. The TNC, TNMD, and phosphorylated PI3K/AKT (p-PI3K, p-AKT308, and p-AKT473) were significantly increased in Group G. After adding PI3K/AKT pathway inhibitors, the expression of TNC and TNMD was inhibited simultaneously with phosphorylated PI3K and AKT. (d) Schematic diagram of the signaling pathway of micropattern SF films regulating TSPCs.
