
FIGURE 1.
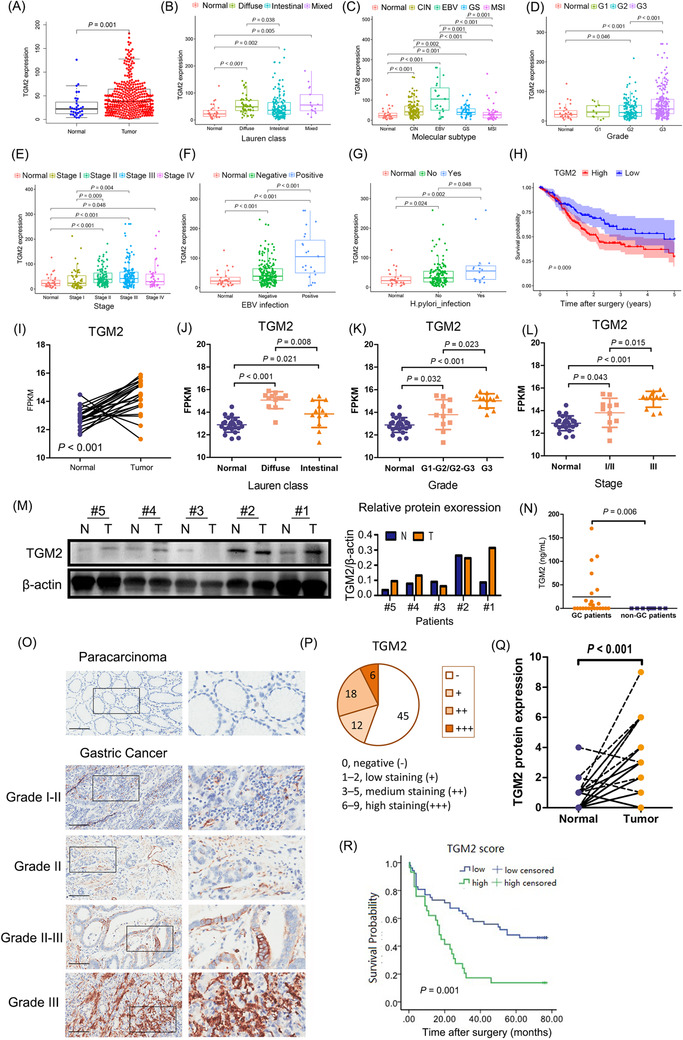
TGM2 was upregulated in GC and associated with GC progression. (A) TGM2 mRNA was significantly higher in GC tissues than the adjacent normal tissues (P = 0.001) based on the TCGA dataset (375 GC tissues and 32 adjacent normal tissues). (B) In the subcategory analysis, TGM2 mRNA was significantly higher in the diffuse subtype than in the intestinal subtype (P = 0.038). (C) In the subcategory analysis, EBV‐positive GC tissues showed the highest TGM2 mRNA expression, which was higher than any other molecular subtype, including CIN (P = 0.002), GS (P = 0.001) and MSI (P < 0.001). (D) In the subcategory analysis, TGM2 mRNA was higher in grade 3 GC tissues than in grade 2 GC tissues (P < 0.001). (E) In the subcategory analysis, TGM2 mRNA showed the highest expression level in stage III GC tissues, which was higher than that in stage I tissues (P = 0.004). (F) In the subcategory analysis, EBV‐positive GC tissues expressed higher levels of TGM2 mRNA than EBV‐negative GC tissues (P < 0.001). (G) In the subcategory analysis, H. pylori‐positive GC tissues had higher TGM2 mRNA expression than H. pylori‐negative GC tissues (P = 0.048). (H) Survival analysis based on the TCGA dataset indicated that higher TGM2 expression was associated with poor OS in patients with GC (P = 0.009). (I) RNA sequencing data of 24 pairs of GC tissues collected from our hospital were analyzed. And the results showed that TGM2 mRNA was generally higher in tumor tissues than in adjacent normal tissues (P < 0.001). (J) In the subcategory analysis, TGM2 mRNA was higher in the diffuse subtype than in the intestinal subtype (P = 0.008). (K) In the subcategory analysis, TGM2 mRNA was higher in grade 3 GC tissues than in grade1‐2/grade 2‐3 GC tissues (P = 0.023). (L) In the subcategory analysis, TGM2 mRNA was higher in stage III GC tissues than in stage I/II tissues (P = 0.015). (M) TGM2 protein expression was confirmed in five pairs of GC tissues by western blotting, which was selected based on TGM2 mRNA level (three pairs with a higher TGM2 mRNA in GC tissues than adjacent normal tissues, one pair with lower TGM2 mRNA in GC tissues than adjacent normal tissues, and one pair with a similar TGM2 mRNA level in GC tissues as adjacent normal tissues), the results showed that TGM2 protein expression pattern was in line with TGM2 mRNA pattern. Bar chart was the quantitative analysis of TGM2 protein. (N) TGM2 was detected in plasma samples from 24 patients with GC and 8 healthy participants by ELISA, and the results showed that TGM2 was detectable in 11 of 24 plasma samples from patients with GC but not in healthy plasma samples (P = 0.006) (O) TMA containing 90 pairs of GC tissues was used to analyze TGM2 protein expression by IHC. Representative micrographs of TGM2 protein expression in GC tissues and adjacent normal tissues in different pathological grades were displayed. Scale bar: 100 µm. (P) IHC assay showed that TGM2 expression was detectable in 36 out of 81 patients with GC, Circle chart summarized the numbers of patients with high/medium‐TGM2 expression and low/negative‐TGM2 expression. (Q) IHC assay showed that IRS was higher in GC tissues than in adjacent normal tissues (P < 0.001). (R) Totally, 81 out of 90 pairs of GC tissues in TMA were enrolled for analysis because of incomplete information, Kaplan‐Meier survival analysis indicated that higher TGM2 expression was associated with poor OS in patients with GC (P = 0.001). Abbreviations: GC, gastric cancer; TCGA, The database the Cancer Genome Atlas; TGM2 transglutaminase 2, ELISA enzyme‐linked immunosorbent assay; IHC, immunohistochemistry; IRS, immunoreactive score; TMA, tissue microarray; EBV, epstein‐barr virus; CIN, chromosomal instability; GS, genomically stable; MSI, microsatellite instable; OS, overall survival.