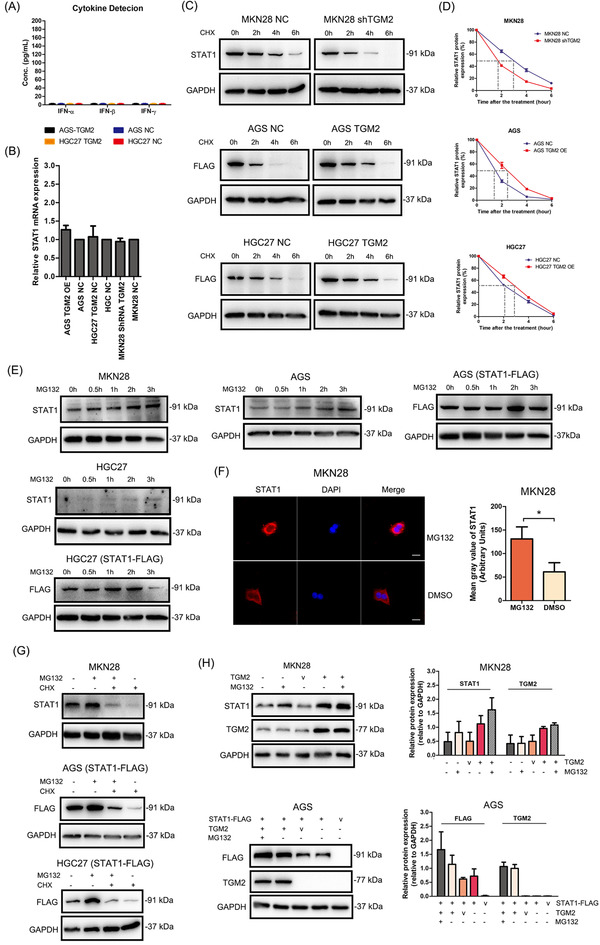
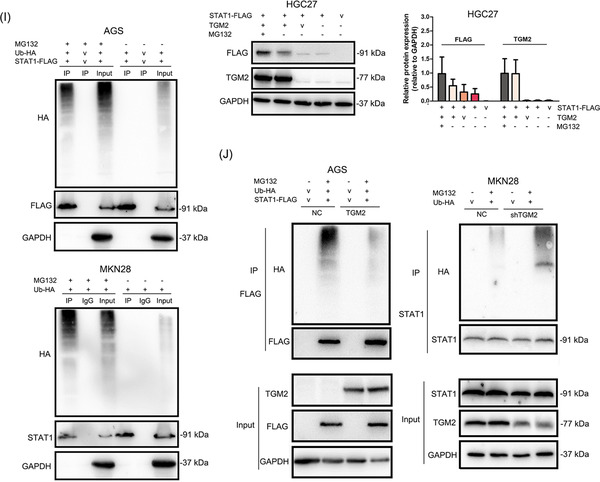
FIGURE 5.
TGM2 promoted STAT1 stability by reducing its ubiquitination/degradation in GC cells (A) IFN‐α, IFN‐β and IFN‐γ levels in the supernatants of GC cells were examined by ELISA, and no detectable IFNs were observed. (B) The effect of TGM2 on STAT1 mRNA was examined by qPCR. And the results showed that TGM2 expression had no effect on the mRNA level of STAT1 in GC cells. The bar chart showed the differences in STAT1 mRNA between TGM2‐overexpressing/TGM2‐knocked down GC cells and NC cells. (C) MKN28 cells were treated with CHX (20 µmol/L) for 2 h, 4 h and 6 h to examine the changes of endogenous STAT1 levels by western blotting. AGS and HGC27 cells transfected with STAT1‐FLAG plasmids were treated with CHX (20 µmol/L) for 2 h, 4 h and 6 h to examine the changes in exogenous STAT1 levels by western blotting. The results showed that CHX reduced STAT1 levels in a time‐dependent manner, and TGM2 prolonged the half‐life of endogenous and exogenous STAT1 in GC cells. (D) The curve charts showed the half‐life of STAT1 in the context of TGM2 expression. (E) MKN28, AGS and HGC27 cells were treated with MG132 (10 µmol/L) for 0.5 h, 1 h, 2 h and 3 h to examine the changes of endogenous STAT1 levels by western‐blotting. And AGS and HGC27 cells transfected with STAT1‐FLAG plasmids were treated with MG132 (10 µmol/L) for 0.5 h, 1 h, 2 h and 3 h to examine the changes of exogenous STAT1 levels by western‐blotting. The results showed that MG132 treatment increased the endogenous and exogenous STAT1 levels in GC cells. (F) MKN28 was used as a cell model to observe STAT1 levels after MG132 (10 µmol/L) treatment for ∼2 h by immunofluorescence, and the result showed that MG132 treatment increased STAT1 levels mainly in the cytoplasm. Representative micrographs of immunofluorescence were displayed. The bar charts showed the quantitative analysis of STAT1 protein levels between MG132‐treated cells and DMSO‐treated cells. *: P<0.05; scale bar: 20 µm. (G) GC cells were treated with CHX (20 µmol/L) combined with MG132 (10 µmol/L) or either one for ∼2 h to examine the changes in endogenous and exogenous STAT1 levels by western blotting. The results showed that CHX treatment reversed the effect of MG132 on the endogenous and exogenous STAT1 levels in GC cells. (H) GC cells were transiently transfected with TGM2 plasmid to examine the changes in endogenous and exogenous STAT1 levels in GC cells by western blotting. The results showed that transient TGM2 overexpression increased the endogenous and exogenous STAT1 levels, and MG132 treatment (10 µmol/L, ∼2 h) increased the endogenous and exogenous STAT1 levels more in the context of TGM2 expression in GC cells. The bar charts showed the quantitative analysis of STAT1 and TGM2 protein levels. (I) GC cells were transiently transfected with Ub‐HA plasmid, and Co‐IP and western blotting examined the ubiquitin level of endogenous and exogenous STAT1 in GC cells. The results showed that MG132 treatment (10 µmol/L, ∼2 h) increased the ubiquitin level of the endogenous and exogenous STAT1 in GC cells. (J) GC cells were transiently transfected with Ub‐HA plasmid, and the changes in ubiquitin level of STAT1 in GC cells in the context of TGM2 overexpression were examined by Co‐IP and western blotting. The results showed that TGM2 overexpression reduced the ubiquitin level of STAT1 in AGS cells, while the opposite results were observed when TGM2 was knocked down in MKN28 cells. Abbreviations: GC, gastric cancer; TGM2, transglutaminase 2; IFN, interferon; NC, negative control; v, vector; Co‐IP, co‐immunoprecipitation; IP, immunoprecipitation; Ub, ubiquitin.


