
Fig. 3. Non-stoichiometric accumulation of Tip1 at microtubule plus-ends.
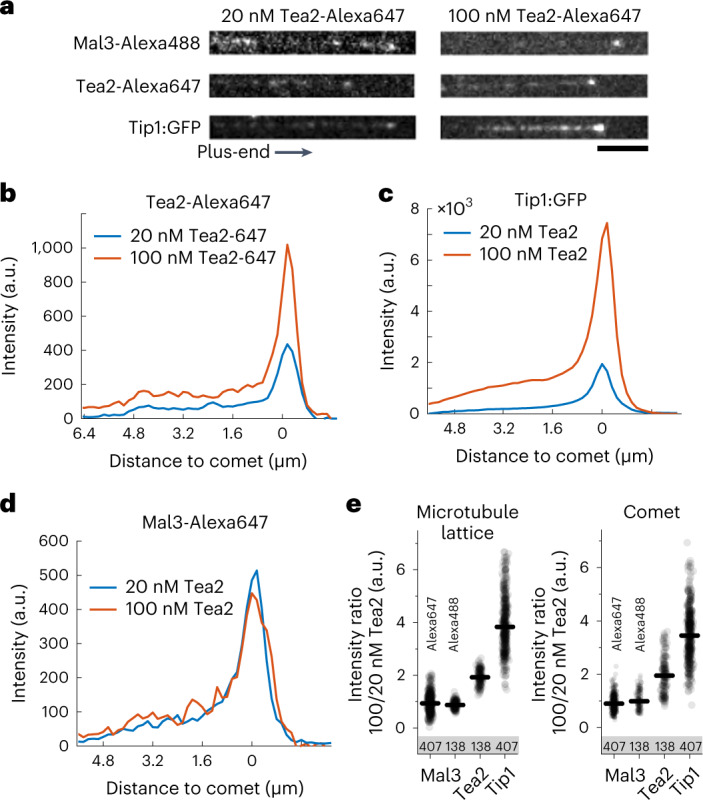
a, Examples of individual Mal3, Tea2 and Tip1 intensity profiles at two different concentrations of Tea2 (20 nM and 100 nM). b, Averaged Tea2-Alexa647 intensity profiles. c, Averaged Tip1:GFP intensity profiles. d, Averaged Mal3-Alexa647 intensity profiles. Data in c and d were extracted from the same experiment for each Tea2 concentration, whereas Tea2-Alexa647 data shown in b were recorded in two separate experiments that contained dark Tip1 and Mal3-Alexa488. Profiles were averaged for microtubules of similar length. See also Extended Data Fig. 4. e, Ratio of lattice (left) and comet (right) intensities between 100 nM and 20 nM Tea2 for microtubules of all lengths. The total number of observed intensity profiles at 100 nM is indicated for each condition. Numerical data are available in source data.