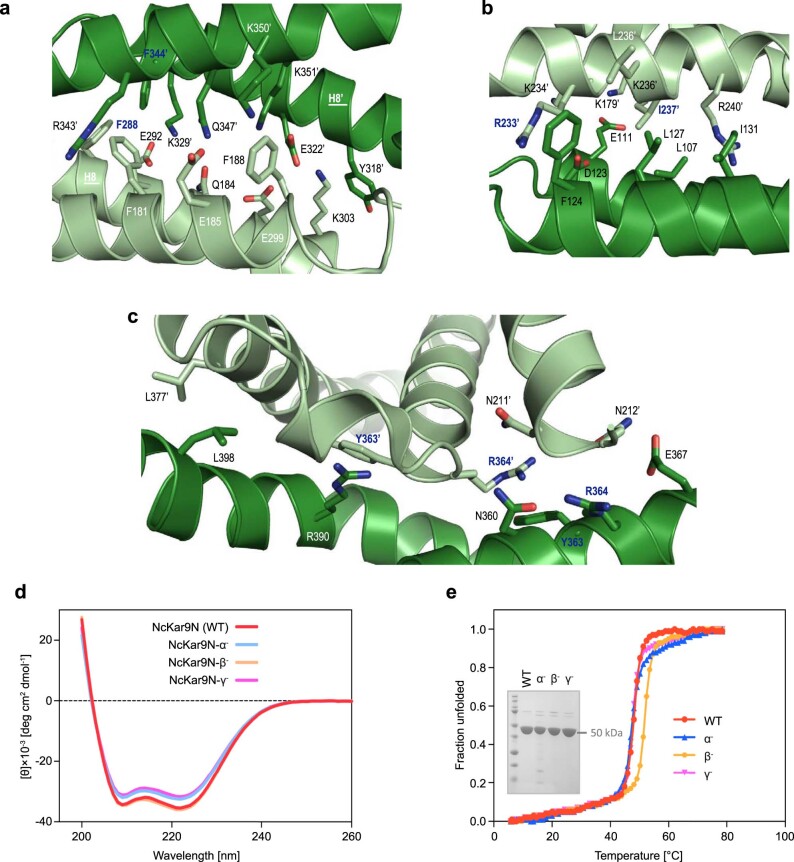
Extended Data Fig. 4. Protomer contacts forming the NcKar9N crystal and NcKar9 dimer interface mutagenesis.
a-c, Close-up views of the α (a), β (b), and γ (c) interfaces seen between protomers in the NcKar9N crystal (PDB ID 7AG9). Interacting residue side chains are shown in stick representation. Oxygen and nitrogen atoms are colored in red and blue, respectively; carbon atoms are in dark green for chain A and in light green for chains B, C, and D. Interface residues that were mutated in the three crystallographic dimers are labeled in bold and blue lettering. d and e, Far-ultraviolet CD spectra (d) and thermal denaturation profiles (e) of His-NcKar9N (red), His-NcKar9N-α− (blue), His-NcKar9N-β− (yellow), and His-NcKar9N-γ− (magenta). Inset in (e), SDS-PAGE analysis of the His-NcKar9N variants. Spectra are averages of 3 measurements of the same sample, denaturation profiles are single experiments. Related to Fig. 2.

