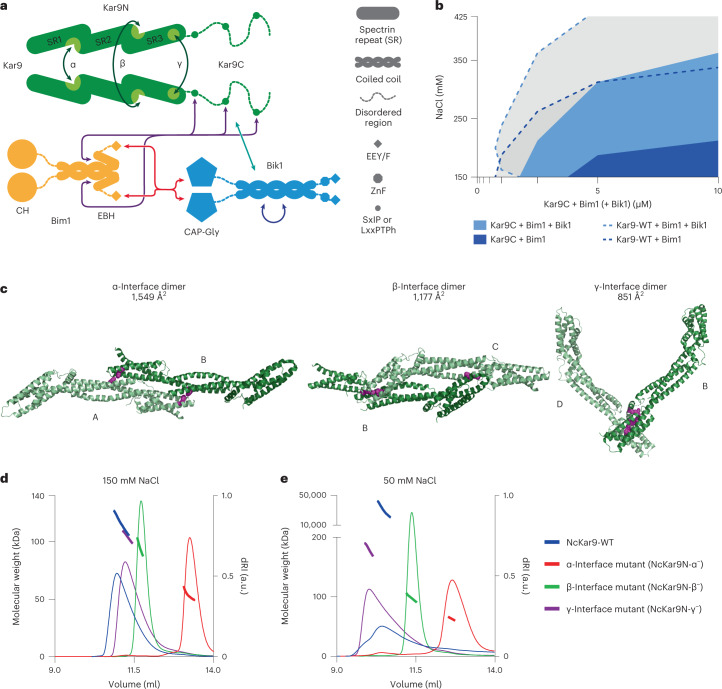
Fig. 2. Characterization of NcKar9N–NcKar9N interactions.
a, Schematic representation of the core Kar9-network module. Known protein–protein interactions between Kar9, Bim1 and Bik1 are indicated by double arrows. Additional information on disordered regions in Extended Data Fig. 3. b, Superimposed phase diagram of Kar9C with Bim1 in the presence (light blue) or absence (dark blue) of Bik1, compared with the phase diagrams of Kar9-WT + Bim1 + Bik1 (dashed light-blue line) and Kar9-WT + Bim1 (dashed dark-blue line) (Fig. 1d). Single experiment. c, The three crystallographic dimers interacting via interfaces α, β and γ in the NcKar9N crystal (PDB ID 7AG9) in ribbon representation. Colour distinguishes protomers; different protomers are denoted A, B, C and D. The residues mutated to disrupt each interface are represented as magenta spheres. d,e, SEC–MALS experiments of His-tagged NcKar9N (blue) and interface mutants NcKar9N-α− (Phe288Ala/Phe344Ala; red), NcKar9N-β− (Arg233Ala/Ile237Ala; green) and NcKar9N-γ− (Tyr363Ala/Arg364Ala; magenta) in the presence of 150 mM (d) or 50 mM (e) NaCl. See also Extended Data Fig. 4. For conservation of interfaces, see Extended Data Fig. 5. Source numerical data available in source data.

