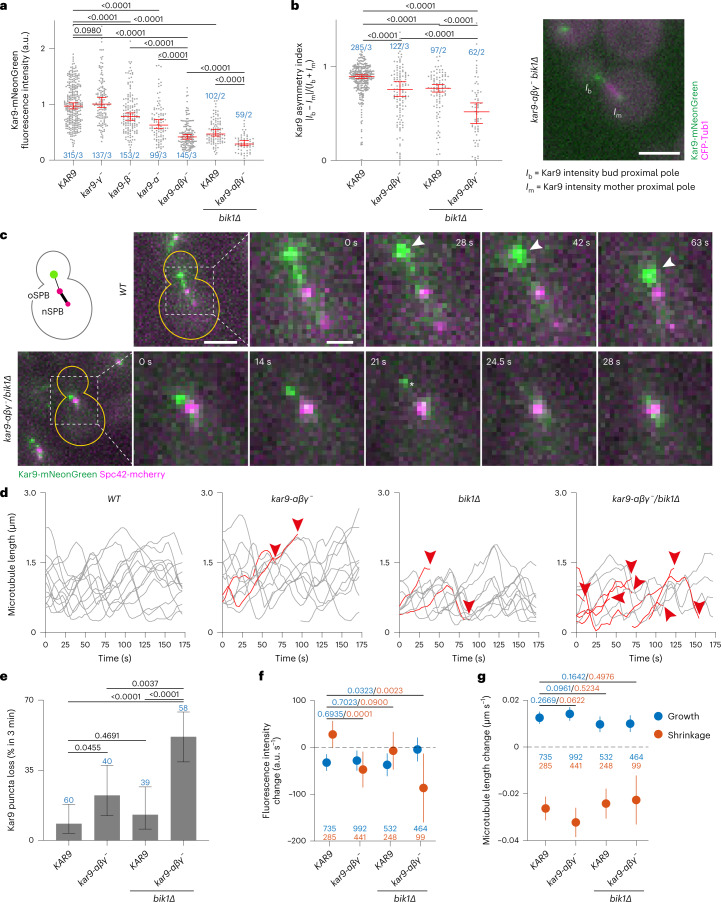
Fig. 5. Dissection of Kar9-pathway defects caused by reduced Kar9-network multivalency.
a, Kar9-mNeonGreen fluorescence intensity levels in Kar9 self-association interface mutants and bik1Δ at 25 °C at a single astral microtubule plus-end (normalized median with 95% confidence intervals). P values determined by Welch’s t-test. For cumulative fluorescence intensity on all plus-ends, see Extended Data Fig. 7. b, Kar9 asymmetry index (Methods) quantifying Kar9-mNeonGreen distribution between astral microtubule tips on both sides of metaphase spindles at 25 °C (median with 95% confidence interval). P values determined by Welch’s t-test. Example for a weakly symmetric kar9-αβγ− bik1Δ cell with labels for quantified intensities is shown on the right. Scale bar, 3 μm. Blue values in a and b indicate n = cells analysed/number of biological replicates. c, Micrographs showing Kar9-mNeonGreen tracking the plus-end of a shrinking astral microtubule in wild type (WT, arrowheads mark the period of shrinkage) and failure to do so in a kar9-αβγ− bik1Δ cell at 25 °C (the asterisk indicating loss of Kar9 punctum). Scale bars, 3 μm and 1 μm (in zooms). See also Supplementary Movies 7 and 8. d, Astral microtubule length profiles for wild-type, kar9-αβγ−, bik1Δ and kar9-αβγ− bik1Δ cells (moving average over three timeframes of distance between Kar9-mNeonGreen and Spc42-mCherry). Profiles persisting for the whole length of the movie are displayed in grey; profiles that end owing to loss of punctum (indicated with arrowhead) in red. e, Frequency of cells losing Kar9-mNeonGreen punctum on astral microtubule plus-ends over 175 s (error bars are Wilson/Brown 95% confidence intervals determined from binomial distribution). P values are determined by two-proportion z-test. Blue values indicate n (cells analysed, single experiment). f,g, Estimated rates of Kar9-mNeonGreen fluorescence change (f) and astral microtubule length change (g) for growing (blue) and shrinking (red) microtubules. Symbols indicate estimates and lines their 95% confidence intervals. Colour of P values (two-sided t-test) and n (number of timeframes considered for the model, single experiment) matches the growth/shrinkage category they refer to. For details, see Methods and Extended Data Fig. 8. Source numerical data available in source data.

