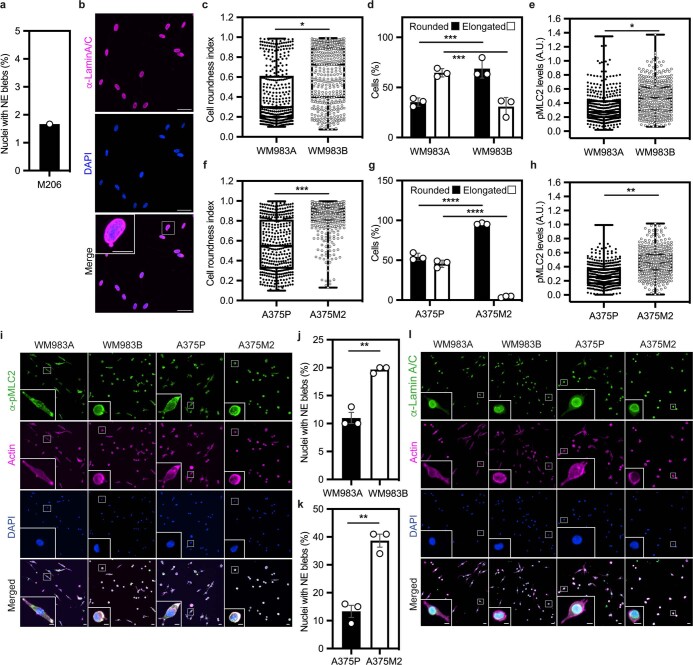
Extended Data Fig. 3. Cell and nuclear morphology changes in melanoma progression.
(a) Percentage of nuclei with nuclear envelope blebs in M206 melanocytes. n = 120 cells. N = 1. (b) Representative image of M206 melanocytes stained for lamin A/C (magenta) and DNA (blue). Scale bars, 30 μm. The magnification shows a M206 nucleus with a nuclear envelope bleb. Scale bar, 10 μm. (c-e) Cell roundness index (c), percentage of elongated and rounded cells (d) and pMLC2 levels (e) in primary melanoma WM983A cells and metastatic melanoma WM983B cells grown on collagen I. n = 375 and 425 cells, respectively. (f-h) Cell roundness index (f), percentage of elongated and rounded cells (g) and pMLC2 levels (h) in less metastatic melanoma A375P cells and highly metastatic melanoma A375M2 cells grown on collagen I. n = 385 and 381 cells, respectively. (i) Representative images of WM983A, WM983B, A375P and A375M2 cells stained for pMLC2 (green), actin (magenta) and DNA (blue) on collagen I. Scale bars, 30 μm. The magnifications show representative cells and in the magnification the scale bars are 10 μm. (j) Percentage of nuclei with nuclear envelope blebs in WM983A and WM983B cells grown on collagen I. n = 337 and 373 cells, respectively. (k) Percentage of nuclei with nuclear envelope blebs in A375P and A375M2 cells grown on collagen I. n = 335 and 331 cells, respectively. (l) Representative images of WM983A, WM983B, A375P and A375M2 cells stained for lamin A/C (green), actin (magenta) and DNA (blue) on collagen I. Scale bars 30 μm. In a,d,g,j,k Bar charts show the mean and error bars represent SEM from N = 3 independent experiments. In c,e,f,h horizontal lines show the median and whiskers show minimum and maximum range of values. p values calculated by two-way ANOVA (d,g) and unpaired two-tailed t-test (c,e,f,h,j,k); **p < 0.01, ***p < 0.001, ****p < 0.0001. Numerical data and exact p-values are available in the Source Data.

