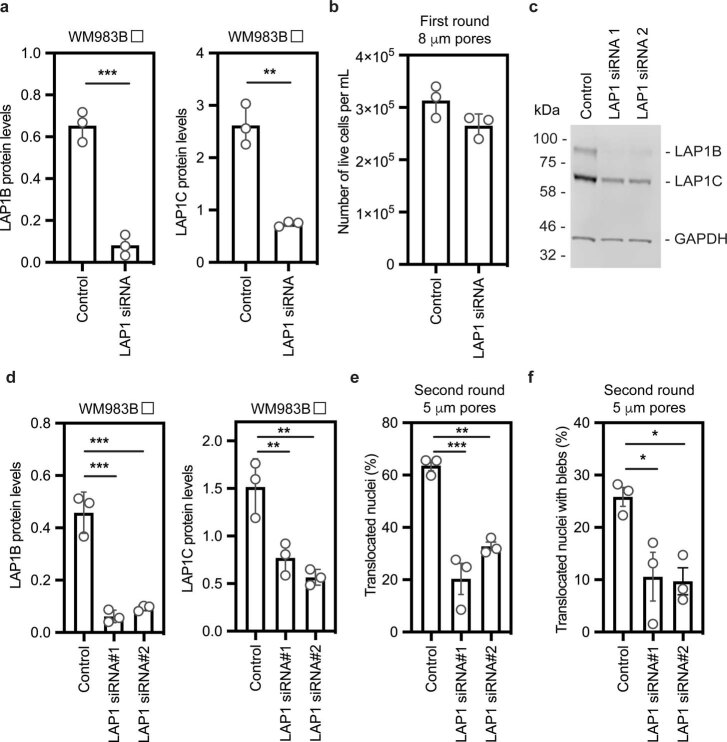
Extended Data Fig. 6. Impact of LAP1 expression levels on metastatic melanoma cells.
(a) Quantification of LAP1B (left) and LAP1C (right) expression in metastatic melanoma WM983B cells after 48 hours of treatment with a siGENOME SMARTpool targeting LAP1. (b) Percentage of alive WM983B cells after a first round of transwell migration upon LAP1 depletion with a siGENOME SMARTpool. (c) Representative immunoblot for LAP1 expression levels in WM983B cells after 48 hours of LAP1 depletion with ON-TARGETplus individual siRNAs. Western blot was probed with anti-GAPDH and anti-LAP1 antisera (d) Quantification of LAP1B (left) and LAP1C (right) expression in WM983B cells after 48 hours of LAP1 depletion with ON-TARGETplus individual siRNAs as in (c). (e,f) Percentage of WM983B cells that translocated their nuclei (e) and displayed nuclear envelope blebs (f) after a second round of transwell migration through 5-μm pores upon LAP1 depletion with ON-TARGETplus individual siRNAs. n = 772, 632 and 590 cells, respectively. Bar charts show the mean and error bars represent S.E.M. from N = 3 independent experiments. P-values calculated by one-way ANOVA (d,e,f) and unpaired two-tailed t-test (a,b); *p < 0.05, **p < 0.01, ***p < 0.001, ****p < 0.0001. Unprocessed western blots, numerical data and exact p-values are available in the Source Data.

