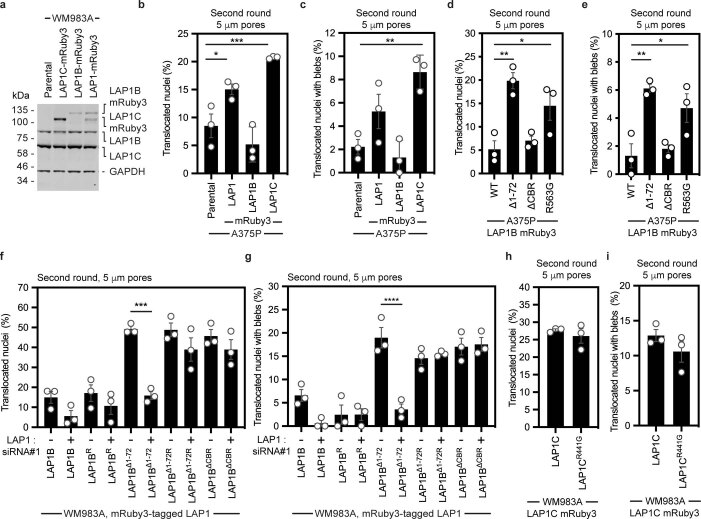
Extended Data Fig. 9. Effects of LAP1 overexpression in vitro.
(a) Representative immunoblot for LAP1 expression levels in primary melanoma WM983A cells stably expressing GFP-NLS and LAP1C-mRuby3, LAP1B-mRuby3 (LAP1 M122A) or LAP1-mRuby3, related to Fig. 5a–d. (b, c) Percentage of less metastatic A375P cells stably expressing GFP-NLS, A375P stably expressing GFP-NLS and LAP1-mRuby3, LAP1B-mRuby3 or LAP1C-mRuby3 that translocated their nuclei (b) and displayed nuclear envelope blebs (c) after a second round of transwell migration through 5-μm pores. n = 374, 316, 344 and 439 cells, respectively. (d, e) Percentage of less metastatic melanoma A375P cells stably expressing GFP-NLS and LAP1B-mRuby3, LAP1BΔ1-72-mRuby3, LAP1BΔCBR-mRuby3 or LAP1BR563G-mRuby3 that translocated their nuclei (d) and displayed nuclear envelope blebs (e) after a second round of transwell migration through 5-μm pores. n = 344, 412, 273, and 317 cells, respectively. (f, g) Percentage of primary melanoma WM983A cells stably expressing GFP-NLS and LAP1B-mRuby3 or LAP1BΔ1-72-mRuby3, or siRNA resistant LAP1B-mRuby3 (LAP1BR-mRuby3), LAP1BΔ1-72-mRuby3 (LAP1BΔ1-72R-mRuby3) or LAP1BΔCBR-mRuby3 that translocated their nuclei (f) and displayed nuclear envelope blebs (g) after a second round of transwell migration through 5-μm pores upon treatment with LAP1 siRNA#1. n = 322, 269, 305, 357, 368, 363, 400, 369, 372 and 375 cells, respectively. Note, OnTarget LAP1 siRNA#1 targets a sequence present within the CBR of LAP1. (h, i) Percentage of WM983A cells stably expressing GFP-NLS and LAP1C-mRuby3 or LAP1CR441G-mRuby3 that translocated their nuclei (h) and displayed nuclear envelope blebs (i) after a second round of transwell migration through 5-μm pores. n = 418 and 388 cells, respectively. Graphs show the mean and error bars represent S.E.M. from N = 3 independent experiments. P-values calculated by one-way ANOVA (b-g) and two-tailed t-test (h, i; n.s.), *p < 0.05, **p < 0.01, ***p < 0.001, ****p < 0.0001. Unprocessed western blots, numerical data and exact p-values are available in the Source Data.

