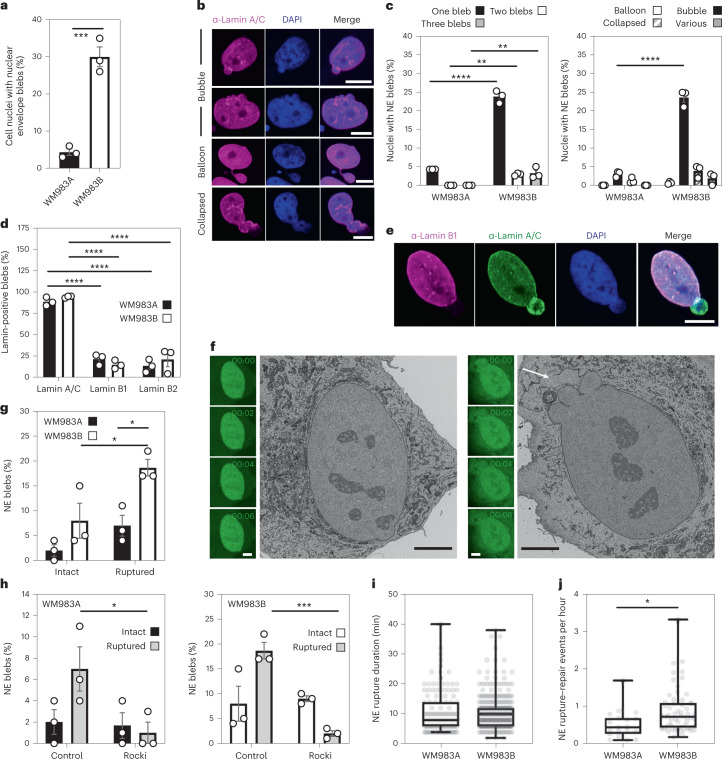
Fig. 2. The NE of metastatic melanoma cells is highly dynamic.
a, Percentage of primary melanoma WM983A and metastatic melanoma WM983B cells grown in 2D displaying NE blebs. b, Representative images of WM983B nuclei with NE blebs of different shapes stained for Lamin A/C (magenta) and DNA (blue). Scale bars, 10 μm. c, Percentage of nuclei with NE blebs according to bleb number per nucleus and bleb shape in WM983A and WM983B cells. n = 434 and 561 cells, respectively. d, Percentage of NE blebs containing Lamin A/C, Lamin B1 or Lamin B2 in WM983A and WM983B cells. n = 605 and 510 cells, respectively. e, Representative images of a WM983B nucleus with an NE bleb stained for Lamin A/C (green), Lamin B1 (magenta) and DNA (blue). Scale bar, 10 μm. f, Representative live-cell image sequence of WM983B GFP-NLS nuclei with an intact NE bleb (left) and a ruptured NE bleb (right) with correlative serial block-face scanning electron microscopy (SBF-SEM) images of the same nuclei. The white arrow indicates the site of rupture of the nuclear membranes. Scale bar, 5 μm. g, Percentage of intact and ruptured NE blebs in WM983A and WM983B cells imaged over the course of 15 h. n = 486 and 453 cells, respectively. h, Percentage of intact and ruptured NE blebs in WM983A (n = 486 and 522 cells, respectively) and WM983B (n = 453 and 560 cells, respectively) cells stably expressing GFP-NLS after treatment with GSK269962A and imaged over the course of 15 h. i, Duration of NE rupture in WM983A and WM983B cells stably expressing GFP-NLS and imaged live (not significant (NS), P = 0.8389). j, NE rupture events per hour in WM983A and WM983B stably expressing GFP-NLS and imaged live. n = 486 and 453 cells, respectively. In a, c, d, g and h, bar charts show the mean and error bars represent s.e.m. from N = 3 independent experiments. In i and j, horizontal lines show the median and whiskers show minimum and maximum range of values. P values calculated by two-way ANOVA (c, d, g and h) and two-tailed unpaired t-test (a, i and j); *P < 0.05, **P < 0.01, ***P < 0.001, ****P < 0.0001. Numerical data and exact P values are available in source data.

