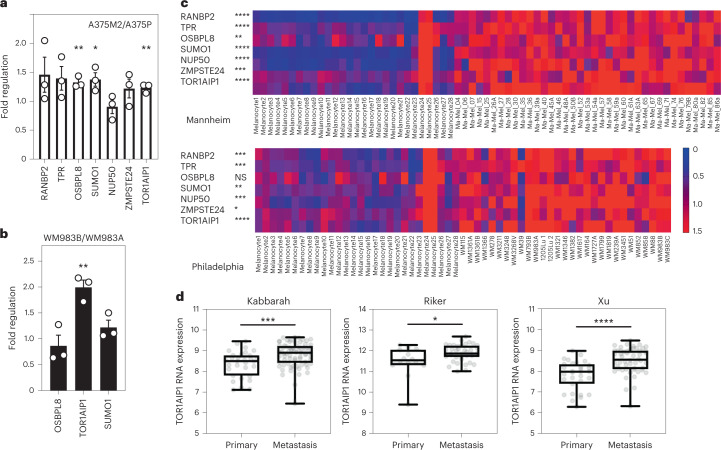
Fig. 3. TOR1AIP1 is upregulated in metastatic melanoma cells.
a, Fold regulation of candidate genes expression validated by RT–qPCR in A375M2 compared with A375P. b, Fold regulation of OSBPL8, TOR1AIP1 and SUMO1 expression validated by RT–qPCR in metastatic melanoma WM983B cells compared with primary melanoma WM983A cells. c, Heat maps displaying fold change in expression of candidate genes in melanoma cell lines compared with melanocytes from Philadelphia and Mannheim datasets. d, TOR1AIP1 expression in primary tumours and metastasis in Kabbarah (n = 31 and 73, respectively), Riker (n = 14 and 40, respectively) and Xu (n = 31 and 52, respectively) melanoma patient datasets. Experimental data have been pooled from three individual experiments. In a and b, bar charts show the mean and error bars represent s.e.m. from N = 3 independent experiments. In d, horizontal lines show the median and whiskers show minimum and maximum range of values. P values calculated by two-tailed unpaired t-test (a–d); *P < 0.05, **P < 0.01, ***P < 0.001, ****P < 0.0001. Numerical data and exact P values are available in source data.

