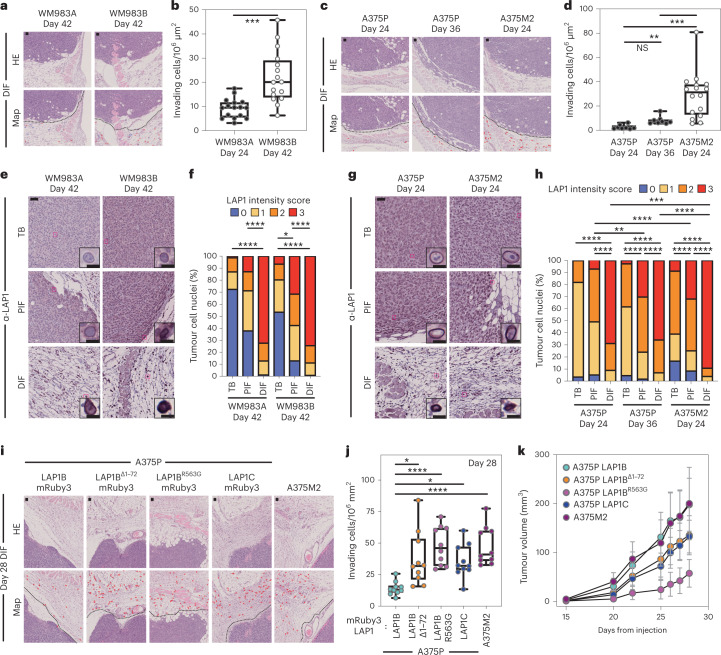
Fig. 6. LAP1C promotes invasion in vivo.
a,b, Representative images and QuPath mark-up (map) of haematoxylin and eosin (HE) staining (a) and quantification of invading cells into the dermis (b) from day 42 WM983A and WM983B tumours grown in NXG mice. Dashed lines represent the boundary between PIF and DIF. HE-positive tumour cells are in red in the map. n = 16 and 16 tumours, respectively. c,d, Representative images and QuPath mark-up of HE staining (c) and quantification of invading cells into the dermis (d) from day 24 and day 36 A375P tumours and day 24 A375M2 tumours grown in NXG mice (d). n = 8, 8 and 16 tumours, respectively. e,f, Representative images (e) and percentage of tumour cell nuclei according to LAP1 intensity score in TB, PIF and DIF (f) of day 42 WM983A and WM983B tumours. n = 16 and 15 tumours, respectively. g,h, Representative images (g) and percentage of tumour cell nuclei according to LAP1 intensity score in TB, PIF and DIF (h) of day 24 and day 36 A375P tumours and day 24 A375M2 tumours. n = 8, 8 and 16 tumours, respectively. i–k Representative and QuPath mark-up of HE staining (i), quantification of invading cells into the dermis (j) and tumour growth curves (k) of A375P GFP-NLS LAP1B-mRuby3, A375P GFP-NLS LAP1BΔ1-72-mRuby3, A375P GFP-NLS LAP1BR563G-mRuby3, A375P GFP-NLS LAP1C-mRuby3 and A375M2 GFP-NLS tumours grown intradermally in NXG mice. n = 10 tumours per condition. In IHC panels, scale bars are 50 μm. In b, d and j, horizontal lines show the median and whiskers show minimum and maximum range of values. In k, graphs show the mean and error bars represent s.d. P values calculated by one-way ANOVA (d and j), two-way ANOVA (f and h) and two-tailed unpaired t-test (b). In f and h, significant P values shown are for LAP1 score 3. *P < 0.05, **P < 0.01, ***P < 0.001, ****P < 0.0001. Numerical data and exact P values are available in source data.

