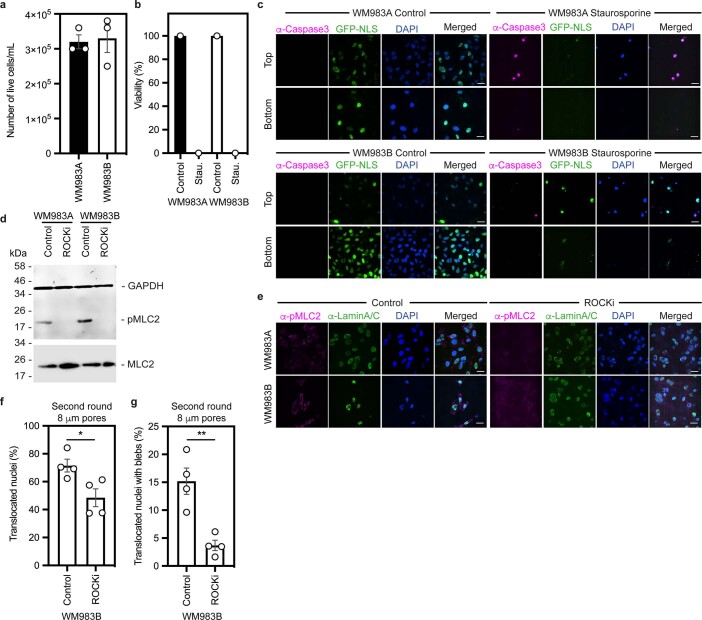
Extended Data Fig. 2. Cell viability and actomyosin contractility in multi-round transwell migration assays with melanoma cells.
(a) Percentage of alive primary melanoma WM983A cells and metastatic melanoma WM983B cells after a first round of migration in transwells through 8-μm pores (b) Percentage of alive WM983A and WM983B cells after a second round of migration in transwells through 5-μm pores upon staurosporin treatment. n = 180 and 213 cells, respectively (N = 1). (c) Representative pictures of WM983A and WM983B cells expressing GFP-NLS (green) and stained for caspase-3 (magenta) and DNA (blue) after a second round of migration in transwells through 5-μm pores in the presence or absence of staurosporin. Scale bars, 30 μm. (d) Resolved cell lysates of WM983A and WM983B cells after treatment with ROCK inhibitor (ROCKi) GSK269962A were examined by western blotting with antisera raised against GAPDH, MLC2 and pMLC2. (e) Representative pictures of WM983A and WM983B cells treated with ROCKi and stained for pMLC2 (magenta), lamin A/C (green) and DNA (blue) after a first round of transwell migration through 8-μm pores. Scale bars, 30 μm. (f,g) Percentage of WM983B cells that translocated their nuclei (f) and displayed nuclear envelope blebs (g) after a second round of transwell migration through 8-μm pores upon ROCK inhibitor (ROCKi) GSK269962A treatment. n = 787 and 691 cells, respectively. Bar charts show means and error bars represent S.E.M. from N = 3 independent experiements, unless otherwise stated. P-values calculated by unpaired two-tailed t-test (a,f,g). *p < 0.05, **p < 0.01. Unprocessed western blots, numerical data and exact p-values are available in the Source Data.

