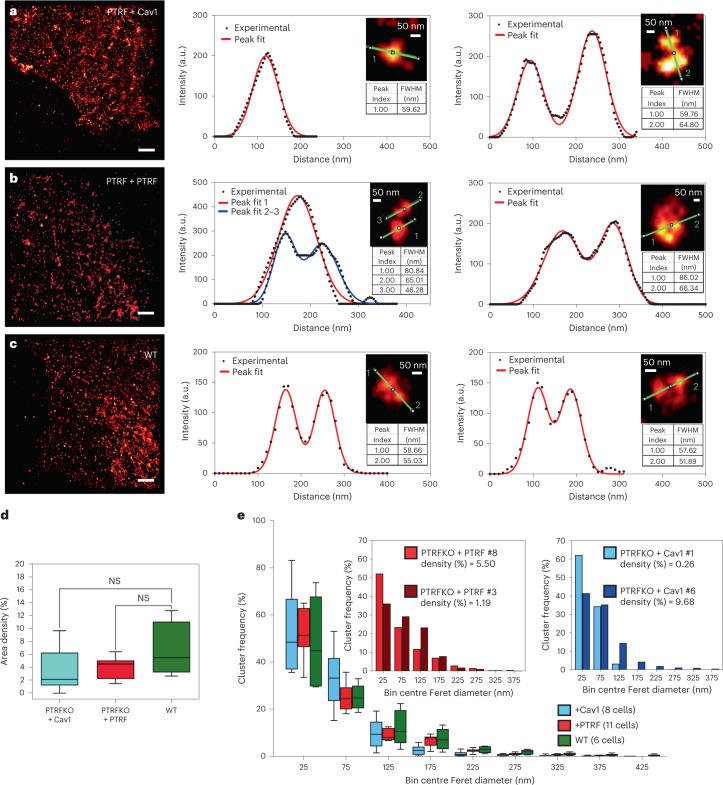
Fig. 4. Cav1 forms clusters of different sizes in the absence of PTRF.
a–c, dSTORM representative images of MEFs of the indicated genotypes (left) and analyses of clusters showing the size and separation of nanostructures (right). These plots were taken from the corresponding dSTORM images and show the cutting curves (green) for profile analysis and full width at half maximum (FWHM) for each fitted peak in representative clusters. Scale bar, 2 µm; a.u., arbitrary units. Results are representative of 6 WT, 10 PTRFKO + PTRF and 11 PTRFKO + Cav1 cells from two independent replicates. d, Cluster density expressed as percentage area for the different MEF genotypes. e, Normalized cluster frequency segmented according to the Feret diameter (longest distance between any two points along the selection boundary44; Results) of PTRFKO + Cav1 MEFs (cyan), PTRFKO + PTRF MEFs (red) and Cav1WT MEFs (green). Insets: normalized cluster frequency of two cells from PTRFKO + Cav1 and PTRFKO + PTRF lines chosen at the minimum (cyan and brown bars) and maximum (blue and red bars) values of cluster density in plot (d). For d and e, boxes show the first quartile (Q1) to the third quartile (Q3) and the central line corresponds to the median. The whiskers go from Q1/Q3 quartile to the lowest/greatest observed data point that falls at a distance of 1.5 times the IQR below/above the corresponding quartile. WT (6 cells pooled from two replicate experiments), PTRFKO + Cav1 (11 cells pooled from two replicate experiments) and PTRFKO + PTRF (10 cells pooled from two replicate experiments). Source numerical data are available in source data.

