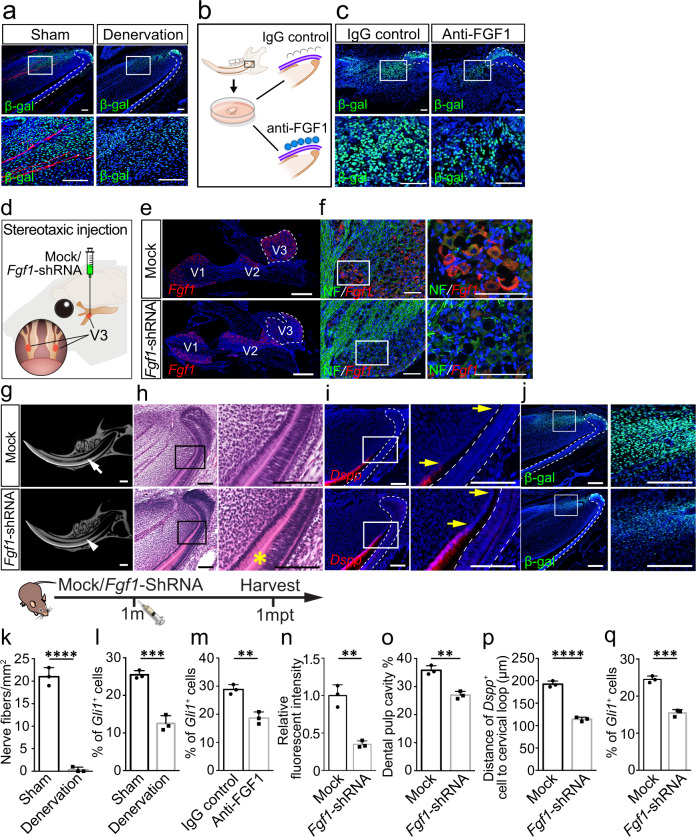
Fig. 3. Sensory nerve-derived FGF1 is crucial for MSC maintenance and mesenchymal tissue homeostasis in the incisor.
a Expression of neurofilament and β-gal in sham and denervation groups after one-month denervation. b and c The proximal ends of Gli1-LacZ mouse incisors surrounded by IAN were cultured with IgG or FGF1 antibody-loaded beads. b Schematic of the incisor explant culture. c Gli1+ cells in incisor explant with IAN surrounding the proximal end cultured with IgG-loaded or FGF1 antibody-loaded beads for 3 days. d The schematic of stereotaxic injection of Fgf1-shRNA. e and f Fgf1 decreased in V3 of trigeminal ganglion after Fgf1-shRNA injection. e Expression of Fgf1 in trigeminal ganglion with mock shRNA or Fgf1-shRNA. V1, V2, and V3 indicate the three branches of the trigeminal nerve. f Expression of Fgf1 and neurofilament in V3 of trigeminal ganglion with mock shRNA or Fgf1-shRNA. g CT scanning of control and Fgf1-shRNA mice one month after injection. White arrow points to the dental pulp cavity; the white arrowhead points to narrowed pulp cavity. h Histological analysis of control and Fgf1-shRNA mice one month after injection. Asterisk points to abnormal dentin formation. i Dspp expression in control and Fgf1-shRNA mice. Yellow arrows point to the distance between the bending point of the cervical loop and the initiation of odontoblast differentiation. j Gli1+ cells stained with β-gal in control and Fgf1-shRNA mice. Schematic at the bottom indicates the induction protocol. k Quantification of nerve fibers in sham and denervation group. P < 0.0001. l Quantification of Gli1+ cells in sham and denervation group. P = 0.0007. m Quantification of Gli1+ cells in IgG and FGF1 antibody group. P = 0.0031. n Relative fluorescent intensity of Fgf1. P = 0.0017. o Quantification of dental pulp cavity percentage in control and Fgf1-shRNA mice. P = 0.0018. p Quantification of the distance of Dspp+ cells to cervical loop in control and Fgf1-shRNA mice. P < 0.0001. q Quantification of Gli1+ cells in control and Fgf1-shRNA mice. P = 0.0003. For k–q n = 3 and each data point represents one animal, with unpaired Student’s t-test performed. All data are expressed as the mean ± SD. Source data are provided as a Source Data file. **P < 0.01, **P < 0.001, ****P < 0.0001. Each experiment was repeated independently three times. White dotted line outlines the cervical loop. Scale bars, g 1 mm; e 500 μm; others, 100 μm.

