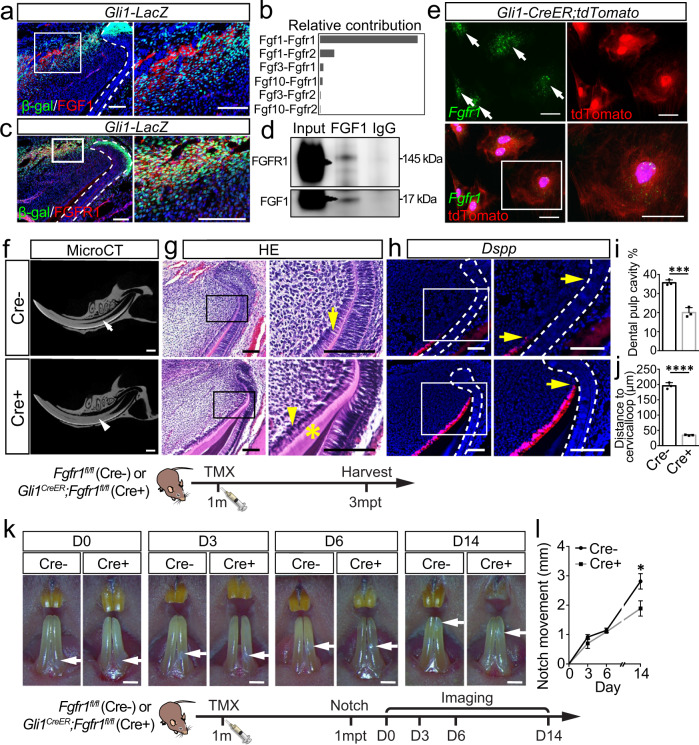
Fig. 4. FGF1 secreted from sensory nerves directly acts on MSCs via FGFR1.
a Expression of FGF1 and β-gal in one-month-old Gli1-LacZ mice. b Relative contributions of ligand-receptor pairs to the overall communication network of FGF signaling pathway; the Fgf1-Fgfr1 pair is the major contributor. c Expression of FGFR1 and β-gal in one-month-old Gli1-LacZ mice. d Immunoprecipitation assay demonstrating the interaction between FGF1 and FGFR1 in the proximal mesenchyme of the incisor. e Expression of Fgfr1 and tdTomato in MSC cultures from Gli1CreER;tdTomato mice. f–j Abnormal dentin formation in Gli1CreER;Fgfr1fl/fl mice three months after tamoxifen induction. f CT imaging of the incisors of Fgfr1fl/fl and Gli1CreER;Fgfr1fl/fl mice. White arrow points to the dental pulp cavity; the white arrowhead points to narrowed pulp cavity. g Histological analysis of Fgfr1fl/fl and Gli1CreER;Fgfr1fl/fl mice. Yellow arrow points to pre-odontoblast; yellow arrowhead points to abnormal pre-odontoblast; asterisk points to abnormal dentin formation. h Expression of Dspp in control and Gli1CreER;Fgfr1fl/fl mice. Yellow arrow points to the distance between the bending point of the cervical loop and the initiation of odontoblast differentiation. i Quantification of dental pulp cavity percentage in control and mutant mice. P = 0.0008. j Quantification of the distance of Dspp+ cells to cervical loop in control and mutant mice. P < 0.0001. Schematic at the bottom indicates the induction protocol. mpt month post-tamoxifen injection. k The growth rate of the incisor was detected with notch movement observed at day (D)3, D6, and D14 in control and Gli1CreER;Fgfr1fl/fl mice. White arrow points to the notch location; the schematic at the bottom indicates the induction protocol. mpt month post-tamoxifen injection. l Quantification of notch movement in control and mutant mice. P = 0.0123. For I, j and l, n = 3 and each data point represent one animal, with unpaired Student’s t-test performed. All data are expressed as the mean ± SD. Source data are provided as a Source Data file. ***P < 0.001, ****P < 0.0001. Each experiment was repeated independently three times. White dotted line outlines the cervical loop. Cre-: Fgfr1fl/fl; Cre+: Gli1CreER;Fgfr1fl/fl. Scale bars, f 1 mm; k 2 mm; e 50 μm; others, 100 μm.

