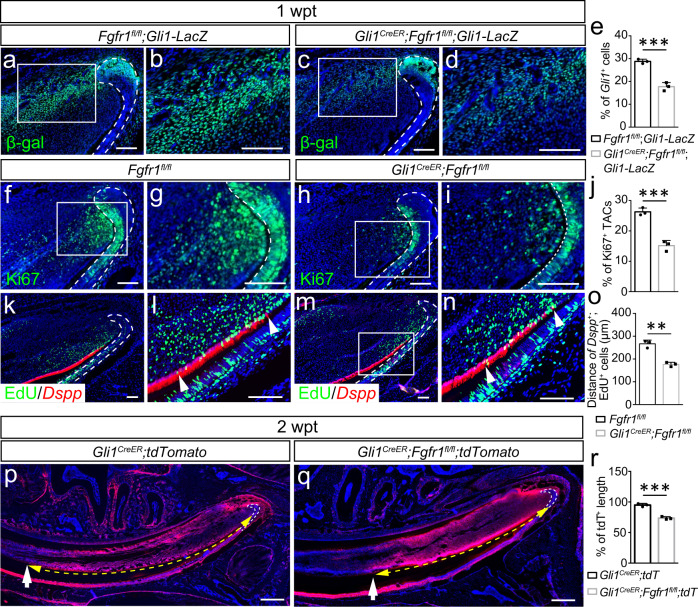
Fig. 5. FGF signaling depletion disturbs stem cell homeostasis.
a–d The number of MSCs decreased in Gli1CreER;Fgfr1fl/fl mice one week after tamoxifen induction. Gli1+ cells stained with β-gal in incisors of control and Gli1CreER;Fgfr1fl/fl mice. e, Quantification of the percentage of Gli1+ cells in control and mutant mice. P = 0.0007. f–i TACs detected with Ki67 staining in control and Gli1CreER;Fgfr1fl/fl mice. j Quantification of Ki67+ TACs in control and mutant mice. P = 0.0008. k–n The expression of Dspp and EdU in control and Fgfr1fl/fl mutant mice. The length of overlap between Dspp+ odontoblasts and EdU+ cells reflects the number of TACs undergoing odontoblastic differentiation. White arrowhead points to overlap between Dspp+ odontoblasts and EdU+ cells. o Quantification of overlap between Dspp+ odontoblasts and EdU+ cells in control and mutant mice. P = 0.0011. p and q The migration of Gli1+ cells’ progeny indicated with tdTomato in Gli1CreER;tdTomato and Gli1CreER;Fgfr1fl/fl;tdTomato mice. White arrows point to tdTomato+ cell migration. Yellow dot line with arrowheads point to migration distance. r Quantification of the percentage of tdTomato length in control and mutant mice. P = 0.0005. For e, o and r, n = 3 and each data point represents one animal, with unpaired Student’s t-test performed. All data are expressed as the mean ± SD. Source data are provided as a Source Data file. **P < 0.01, ***P < 0.001. Each experiment was repeated independently three times. White dotted line outlines the cervical loop. Scale bars, p and q 400 μm; others, 100 μm.

