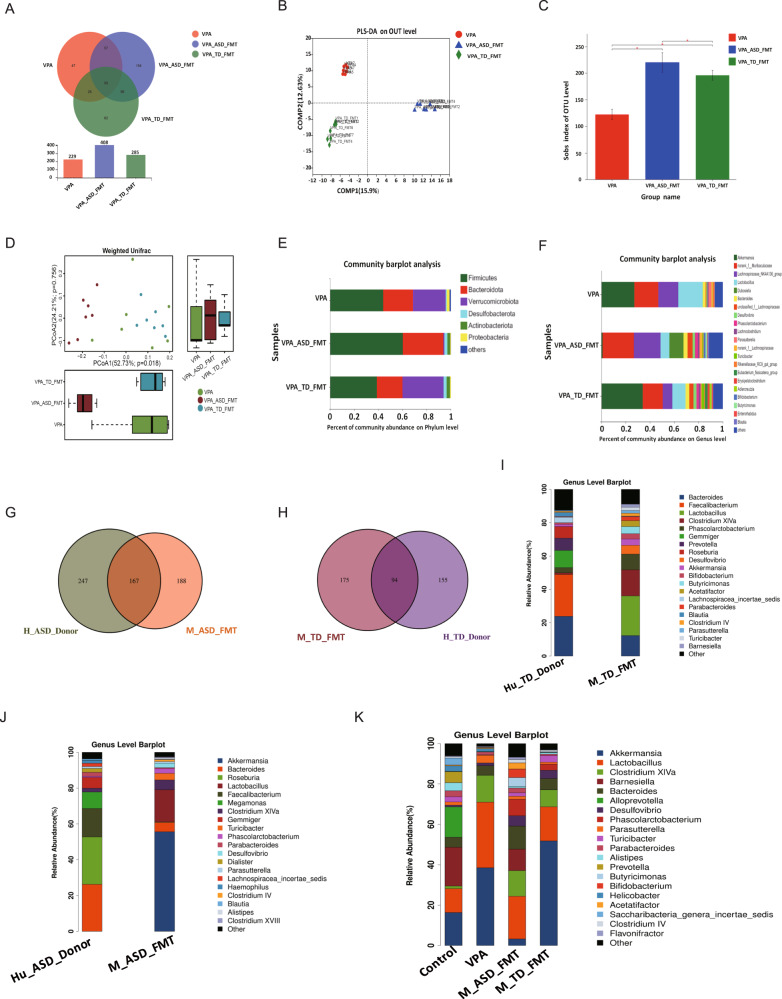
Fig. 2. Changes in the gut microbiota composition in VPA-treated mice after FMT.
A Venn diagram depicting the number of bacterial taxa that were unique and shared between the VPA, VPA_ASD_FMT and VPA_TD_FMT groups; (B) PLS-DA score plot based on OTUs of the microbial community in the three groups. Smaller distances between two points indicate greater similarity in microbial community structure between the two samples. PLS-DA: partial least squares discriminant analysis; (C) Alpha-diversity of the gut microbiota (sob index) in the three groups; (D) Beta-diversity of the gut microbiota in the three groups; (E) Relative abundances of bacterial taxa at the phylum level; (F) Relative abundances of bacterial taxa at the genus level. Only phyla with an average relative abundance >1% and genera >5% are shown. G Venn diagram depicting the number of bacterial taxa that were unique and shared between the Human_ASD_donor and VPA_ASD_FMT groups. H Venn diagram depicting the number of bacterial taxa that were unique and shared between the Human_TD_donor and VPA_D_FMT groups. I Relative abundances of bacterial taxa in the Human_ASD_donor and VPA_ASD_FMT groups at the genus level. J Relative abundances of bacterial taxa in the Human_TD_donor and VPA_TD_FMT groups at the genus level. K Relative abundances of bacterial taxa in the four groups of mice at the genus level.

