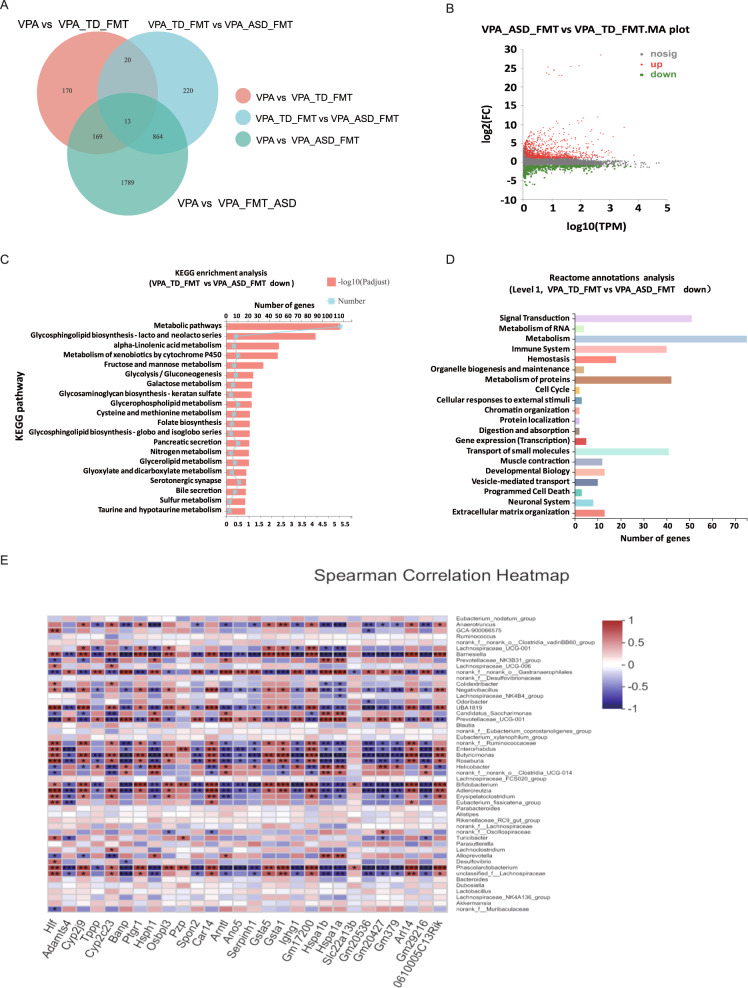
Fig. 3. Gene expression profiling analysis of colon tissues from VPA-treated mice after FMT treatment.
A Venn diagram showing the total number of expressed genes in each group in the large circles, and the number of genes expressed in both groups are shown in the overlapping portion of the circles. B Volcano map showing the significantly differentially expressed genes represented by red dots (upregulated) and green dots (downregulated) for the VPA_TD_FMT group and the VPA_ASD_FMT group. C KEGG enrichment analysis showing the top 20 signaling pathways affected by DEGs between the VPA_TD_FMT group and the VPA_ASD_FMT group. D Reactome annotation analysis of the DEGs between the VPA_TD_FMT group and the VPA_ASD_FMT group. Twenty statistically significant pathways are listed. E Correlation between the changes in the relative abundances of individual genera and DEGs involved in the serotonergic synapse pathway and glutamatergic synapse pathway in the colon tissue of the VPA_TD_FMT group and the VPA_ASD_FMT group. P-values were corrected for multiple testing using the Benjamini‒Hochberg false discovery rate. *p < 0.05, **p < 0.01.

