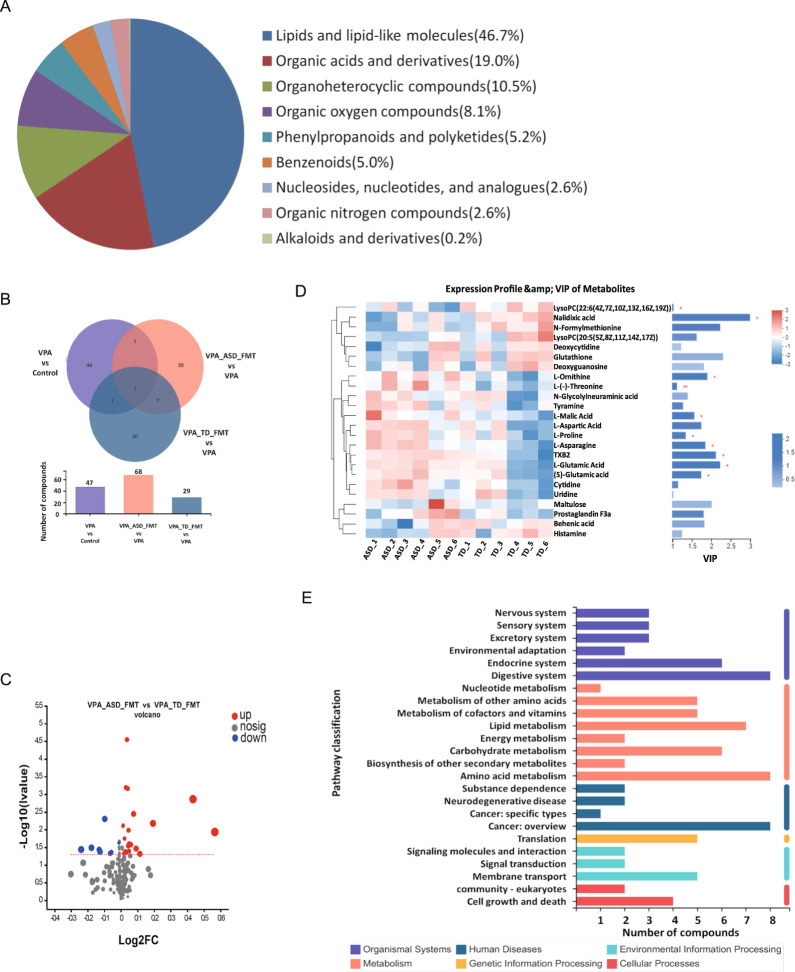
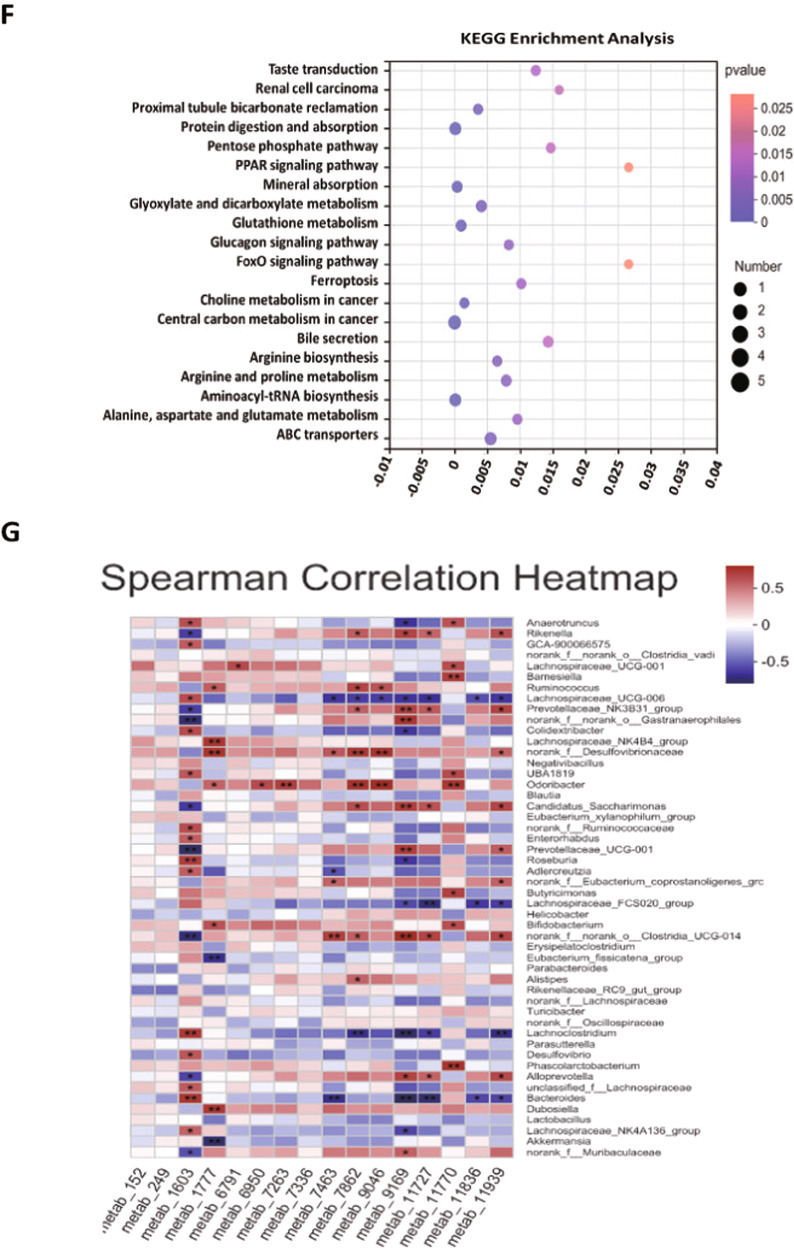
Fig. 4. Effects of FMT on the metabolic differences in the serum samples of VPA-treated mice.
A HMDB compound classification of serum metabolites between the VPA_TD_FMT group and the VPA_ASD_FMT group; (B) Venn diagram showing the total number of metabolites in each group in the large circles, and the number of metabolites in both groups is shown in the overlapping portion of the circles; (C) Volcano plot of the differential metabolites of serum in the VPA_TD_FMT group and the VPA_ASD_FMT group; (D) Heatmap showing the abundances of the top 24 differential metabolites based on VIP scores of the VPA_TD_FMT group and the VPA_ASD_FMT group; (E) Serum KEGG pathways between the VPA_TD_FMT group and the VPA_ASD_FMT group; (F) KEGG enrichment pathways for serum metabolites in the VPA_TD_FMT group and the VPA_ASD_FMT group; (G) Correlation between the changes in serum metabolites and changes in genus abundance. The heatmap shows the Spearman correlation coefficient between the changes in serum metabolite concentrations and changes in the relative abundances of individual genera. The intensity of the colors represents the degree of association between the changes in the concentrations of serum metabolites and changes in the relative abundances of individual genera as measured by Spearman’s correlations. P-values were corrected for multiple testing using the Benjamini‒Hochberg false discovery rate. *p < 0.05.


