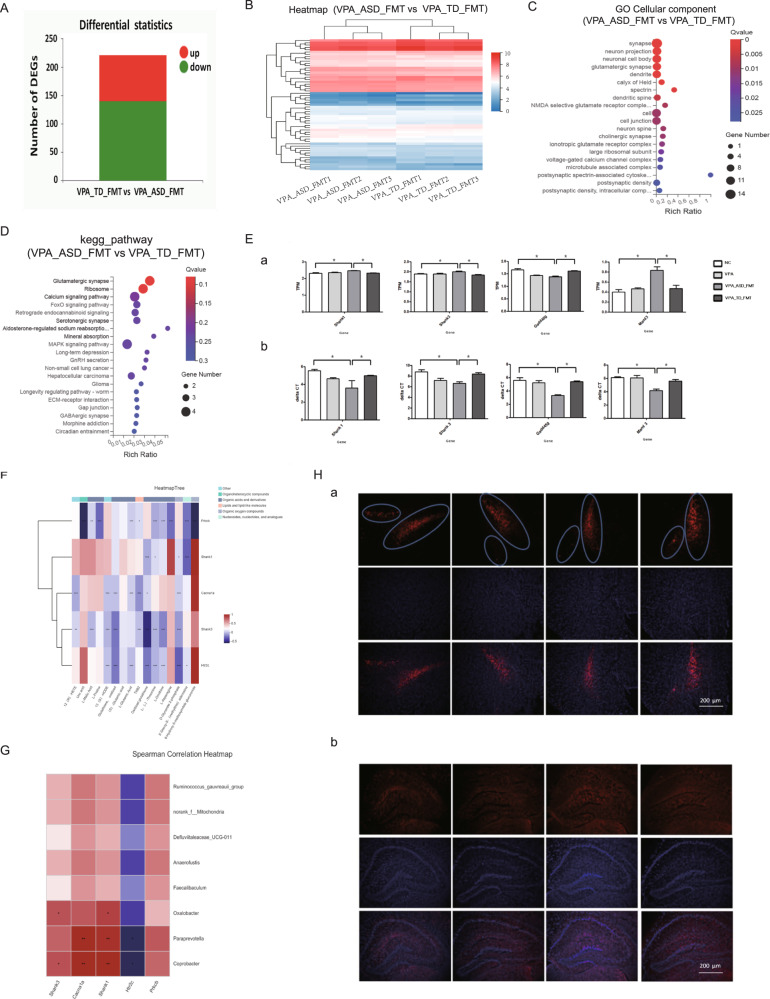
Fig. 5. Patterns of host gene expression changes in the brain tissue of mice in response to FMT.
A–D Differentially expressed genes (DEGs) involved in the brain of the VPA_TD_FMT group and the VPA_ASD_FMT group. A Up- and downregulation of differentially expressed genes. B Heatmap of DEGs in the VPA_TD_FMT group and the VPA_ASD_FMT group. Red shows upregulated DEGs, and blue shows downregulated DEGs. C Gene Ontology (GO) analysis of DEGs in the brain tissue of the VPA_TD_FMT group and the VPA_ASD_FMT group. D Enriched KEGG pathways of DEGs in the brain tissue of the VPA_TD_FMT group and the VPA_ASD_FMT group. E Differentially expressed genes (DEGs) related to the serotonergic synapse pathway and glutamatergic synapse pathway. (a), (c) Expression of eight DEGs. (b), (d) Relative gene expression verification of eight DEGs. F Correlation between the changes in serum metabolites and DEGs involved in the serotonergic synapse pathway and glutamatergic synapse pathway in the brains of the VPA_TD_FMT group and the VPA_ASD_FMT group. G Correlation between the changes in the relative abundance of individual genera and DEGs involved in the serotonergic synapse pathway and glutamatergic synapse pathway in the brains of the VPA_TD_FMT group and the VPA_ASD_FMT group. P-values were corrected for multiple testing using the Benjamini‒Hochberg false discovery rate. *p < 0.05, **p < 0.01; H (a) Tyrosine hydroxylase (TH) immunofluorescence staining of the mice after FMT. Microphotographs showing the distribution of dopaminergic neurons in the hippocampal region of the brain in response to FMT; (b) c-Fos activation patterns in the hippocampal region in response to FMT, Scale bar is 200 μm.

