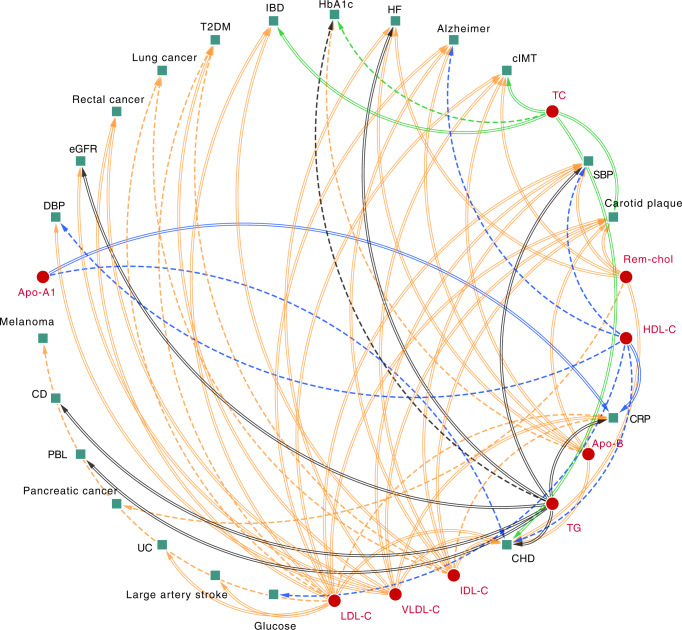
Fig. 3. A causal network of phenotypic consequences of higher cholesterol-containing lipoprotein and apolipoprotein blood concentration.
The network represents highly supported pathways that likely act independently of LDL-C, HDL-C and TG (which are included as reference). Arcs belonging to the endogenous pathway (VLDL-C, IDL-C, LDL-C, and Apo-B) were coloured yellow, arcs for HDL-C and Apo-A1, belonging to the reverse cholesterol transport pathway were depicted in blue, TC and TG arcs were represented as black and green, respectively. An increasing effect of a higher exposure concentration was mapped to a double lined arc, a decreasing effect to a dashed arc. An arc was included when the MR effects were significant at an alpha of 0.05 and showed directionally concordant results in at least three of out five potential models (four for LDL-C, HDL-C, and TG): I) total effects, the direct effects conditional II) on LDL-C, III) on HDL-C, IV) on TG, and V) all three blood lipids; see “Methods”. Please see the Fig. 2 for a definition of the abbreviations.

