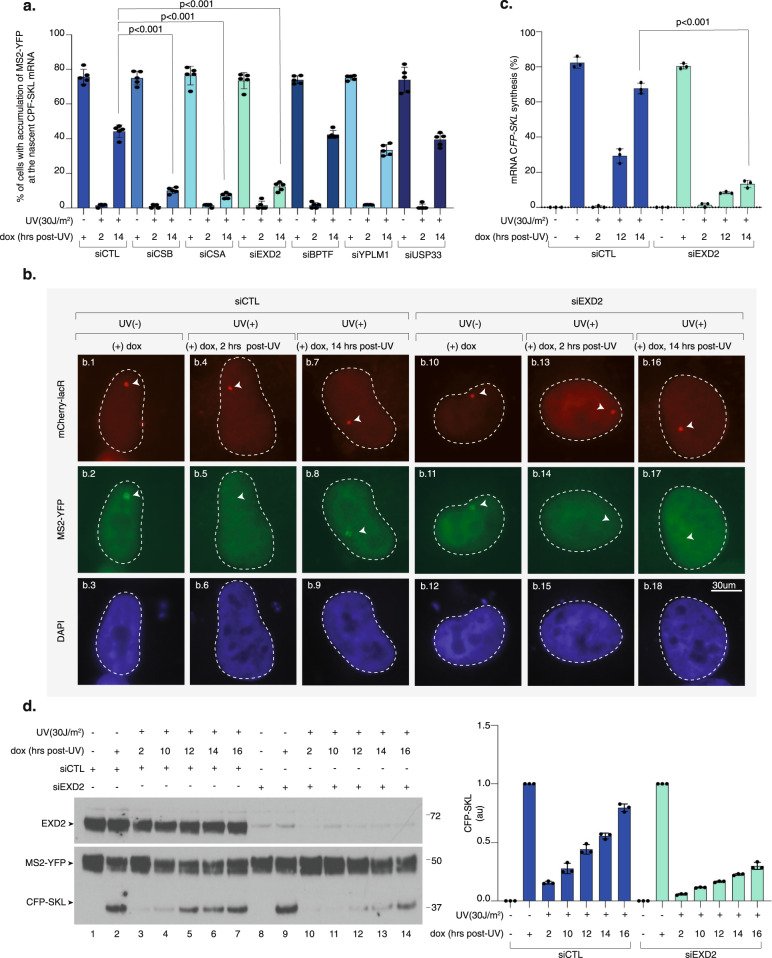
Fig. 1. Knockdown of EXD2 impairs RRS of CFP-SKL.
a U-2 OS cells were transfected with siRNA for 24 h, then with a construct expressing mCherry-lacR for 24 h before UV irradiation (30 J/m2) and 2-h pulse-incubation with dox starting at various time points post-UV. Nascent CFP-SKL mRNAs were detected at the reporter locus by accumulation of the MS2-YFP protein to the MS2 RNA loop. Quantification of the transcribing locus is expressed as % of cells showing YFP-MS2 accumulation at a single locus (n = at least 250 cells in five independent experiments). Bars represent mean values of three different experiments (Biological triplicates) (+/−SD). One-way ANOVA with post-hoc Tukey adjustment comparisons were used to determine the p-values. Source data are provided as a Source Data file. b Representative confocal images of cells treated with siCTL or siEXD2. Images of the cells were obtained with the same microscopy system and constant acquisition parameters. c Cells were treated as described above and after the 2-h pulse-incubation with dox, the relative amount of CFP-SKL mRNA was quantified by RT-qPCR. Bars represent mean values of three different experiments (Biological triplicates) (+/−SEM). One-way ANOVA with post-hoc Tukey adjustment comparisons were used to determine the p-values. Source data are provided as a Source Data file. d U-2 OS cells were treated as described above. After the 2-h pulse-incubation with dox, the cells were let to recover for 4 h before lysis. Extracts were resolved by SDS-PAGE and immuno-blotted with anti-GFP (recognizing both the MS2-YFP and CFP-SKL proteins) and anti-EXD2. Lanes 1 and 8 are negative controls in which cells were not treated with dox. Lanes 2 and 9 are positive controls in which cells were treated with dox for 2 h before to recover 4 h in the absence of dox. Molecular sizes are indicated (KDa). CFP-SKL signals were quantified using ImageJ software (NIH), normalized with YFP-MS2 signals and reported on the graph (1 is the value for dox (+) for siCTL or siEXD2). Bars represent mean values of three different experiments (Biological triplicates) (+/−SEM). Source data are provided as a Source Data file.

