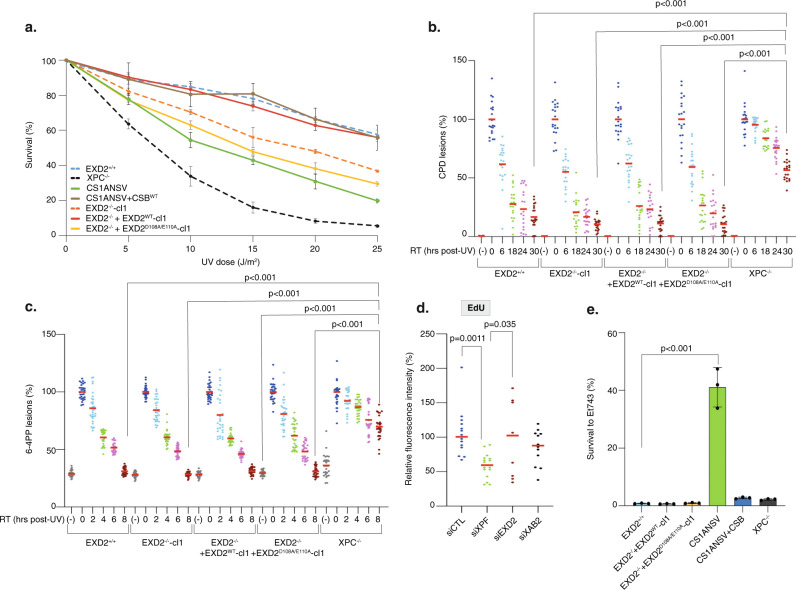
Fig. 3. Knockdown of EXD2 nuclease activity sensitizes cells to UV irradiation.
a Cells were treated with increasing doses of UV irradiation and survival was determined 48 h later. Data were normalized to the mock treatment controls (as value of 100). The values are the means of three independent experiments (+/−SEM) (Technical triplicates). Source data are provided as a Source Data file. b, c Removal of UV lesions was measured in cells, harvested at different time points post-UV (15 J/m2) as indicated. Cells were labeled with anti-CPD (b) or anti-6-4PP (c) antibodies and signals were quantified using ImageJ at the different times indicated in the figure. Graph represents the % of lesions remaining in the genome at different time points normalized to the amounts of lesions measured immediately after UV irradiation (as a value of 100%). For each time point, a mean of 30 cells has been analyzed. Red bars indicate mean integrated density. RT; recovery time. (-); cells were mock-irradiated. 0; cells were irradiated and fixed immediately. One-way ANOVA with post-hoc Tukey adjustment comparisons were used to determine the p-values. Source data are provided as a Source Data file. d GG-NER deficient XPC−/− cells were treated either with siRNA against the TC-NER factor XAB2, the TC- and GG-NER factor XPF or against EXD2 for 24 h before local UV irradiation (50 J/m2) and EdU staining. The local TCR-UDS signals were quantified by ImageJ and reported on the graph. At least 15 cells were quantified for each situation. Red bars indicate mean integrated density. One-way ANOVA with post-hoc Tukey adjustment comparisons were used to determine the p-values. Source data are provided as a Source Data file. e Cells were treated with Et743 (0.5 nM) and survival was determined 48 h later. Data were normalized to the mock treatment controls (as a value of 100). The values are the means of three independent experiments (+/−SEM) (Biological triplicates). One-way ANOVA with post-hoc Tukey adjustment comparisons were used to determine the p-values. Source data are provided as a Source Data file.

