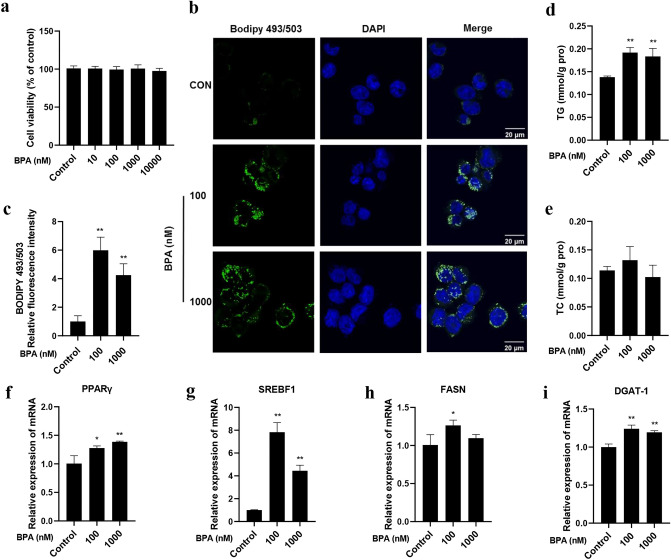
Figure 1.
BPA promoted lipid accumulation in LO2 cells. (a) Different concentrations of BPA (10, 100, 1000, 10,000 nM) were added to LO2 cells for 24 h, and MTT assay was performed to assess the cell viability. (b) BODIPY 493/503 staining was performed for lipid droplets. Scale bar = 20 μm. (c) The relative quantification of BODIPY 493/503 fluorescence intensity. (d) TG levels and (e) cholesterol levels in LO2 cells. The mRNA expression levels of (f) PPARγ, (g) SREBF1, (h) FASN and (i) DGAT-1 were measured by qRT-PCR. Data were expressed as the mean ± SD of 3 independent experiments. *p < 0.05 and **p < 0.01, compared with control group.

