Fig. 2.

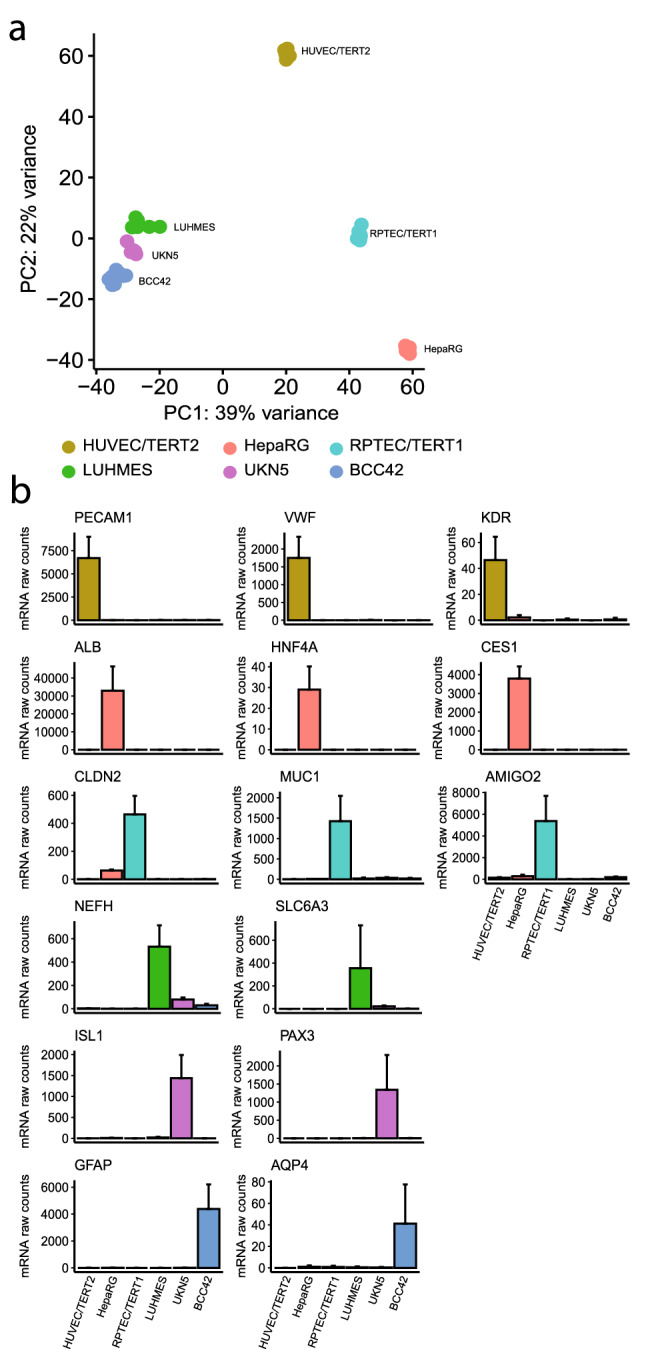
Basal transcriptomic differences across cell models a Principal Component Analysis (PCA) using rlog transformed expression values of mRNA counts. Untreated samples (medium controls) from each cell system were used as input for PCA. Each dot represented a sample, color-coded by cell type: HUVEC/TERT2, HepaRG, RPTEC/TERT1, LUHMES, UKN5, BCC42. b mRNA baseline expression of genes representative of each cell model from untreated samples: CD31 protein-coding gene (PECAM1), Von Willebrand factor (VWF), kinase domain receptor (KDR), albumin (ALB), hepatocyte nuclear factor 4 alpha (HNF4A), carboxylesterase 1 (CES1), claudin 2 (CLDN2), mucin 1 (MUC1), Adhesion Molecule With Ig Like Domain 2 (AMIGO2), neurofilament heave polypeptide gene (NEFH), solute carrier family 6, A3 (SLC6A3), insulin gene enhancer protein (ISL1), paired-box homeotic gene 3 (PAX3), aquaporin-4 (AQP4), and glial fibrillary acidic protein (GFAP)
