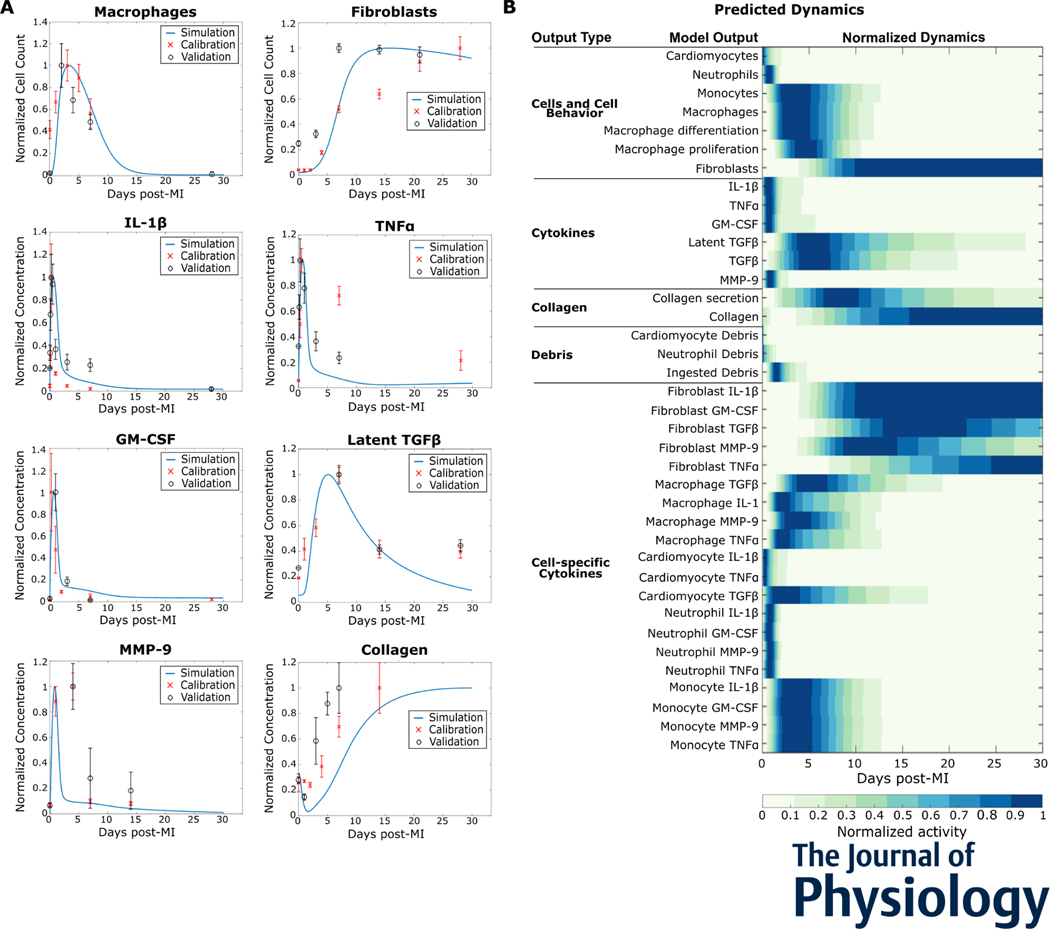
Figure 2:
Intercellular model predicted dynamics measured in mice post myocardial infarction (MI). (A) Predicted dynamics of selected outputs were extended for 30 days after MI. The independent datasets used to calibrate (red cross, x) and validate (black circle, o) the simulated trends are shown for comparison. (B) The predicted dynamics of all the model outputs for 30 days post-MI are shown. All data are normalized to their respective maximum values.

