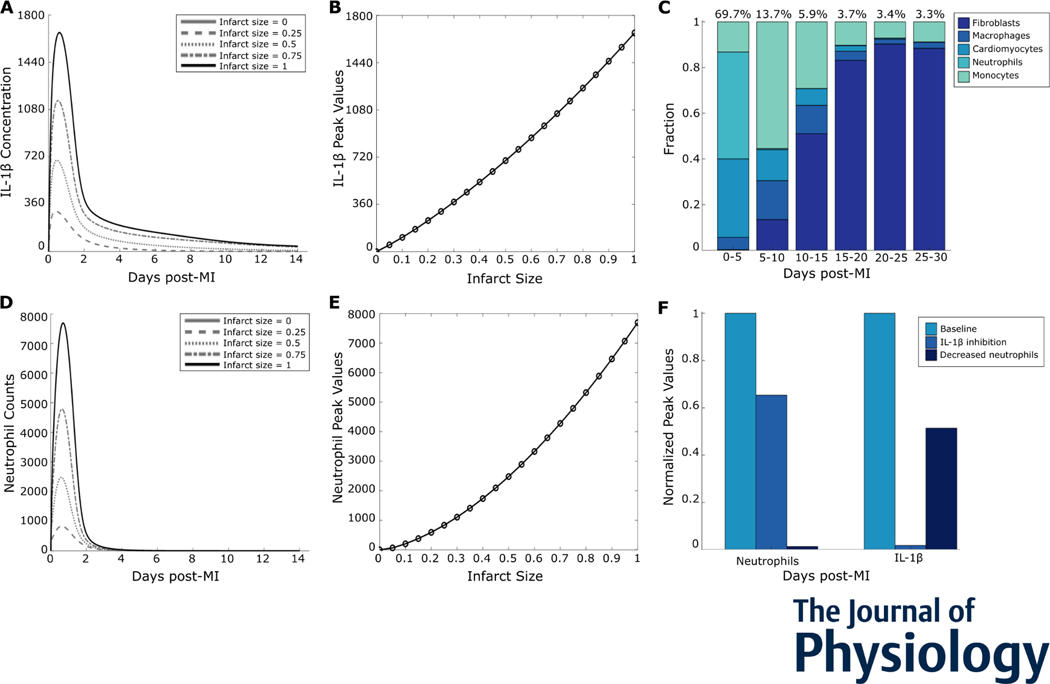
Figure 4:
Inflammation was a graded response to infarction. (A) Predicted IL-1β time courses for select initial infarct sizes. (B) Peak values plotted against initial infarct size indicate a graded increase in the inflammatory response. (C) Cell sources for overall IL-1β in the given time periods post-MI. (D) Neutrophil time courses for select initial infarct sizes. (E) Neutrophil peak values plotted against initial infarct size. (F) Perturbations of neutrophil removal rate or IL-1β degradation rate and their effects on the neutrophil-IL-1β positive feedback loop.

