Figure 5:
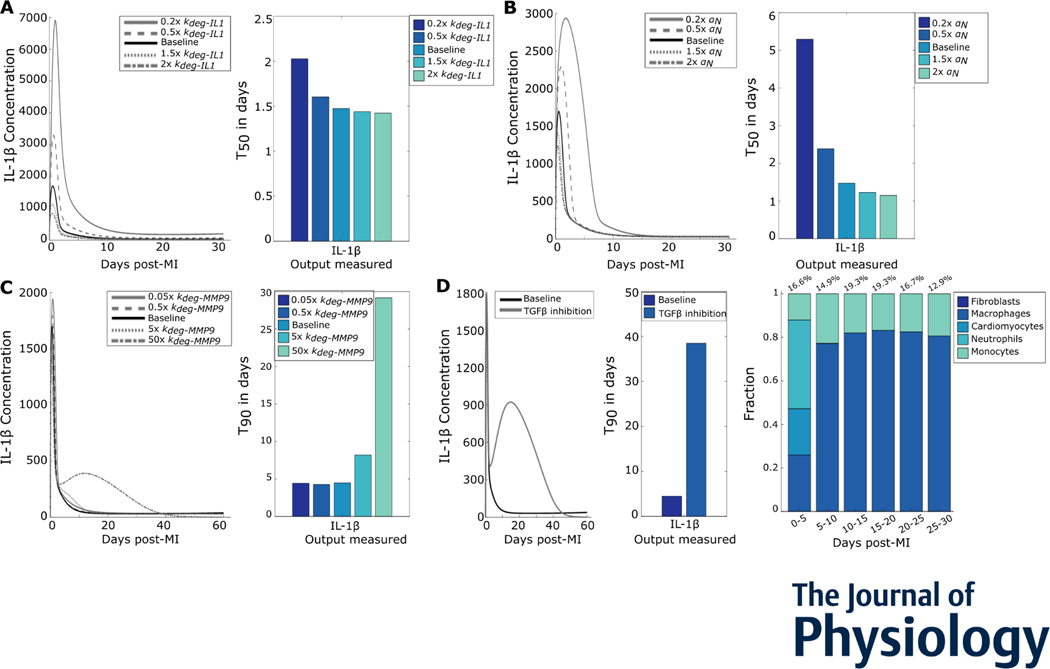
Inflammation resolution was regulated by removal of inflammatory and enhancement of fibrotic processes. (A) IL-1β time courses for varied IL-1β degradation rates (left) show the changes in peak values. The T50s (right) for the perturbations quantify change in inflammation resolution. (B) IL-1β curves for different neutrophil removal rates show the change in peak values and T50s show changes in inflammation resolution. (C) IL-1β time courses for varied MMP-9 degradation rates (left) and inflammation resolution quantified as T90s (right) (D) Effect of TGFβ inhibition on IL-1β duration (left), quantified by the difference in T90 (middle). Cell sources for overall IL-1β after TGFβ inhibition in the given time periods post-MI are shown on the right.

