
FIGURE 1.
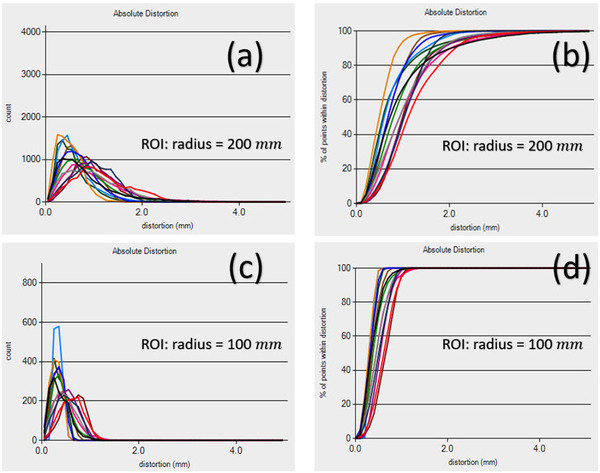
(a) The histogram (b) percentage distribution of control points versus image distortion absolute magnitude for the region of interest (ROI) within the radius of 200 mm for 13 MRI scanners, parts (c) and (d) are those for the ROI within the radius of 100 mm for 13 MRI scanners.