FIGURE 5.

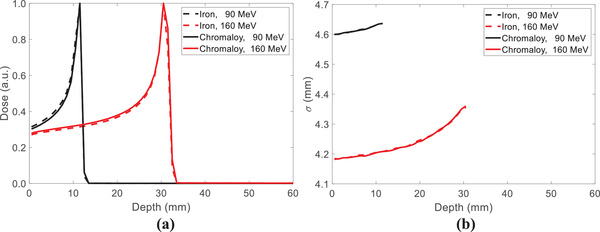
Comparisons of (a) proton ranges and (b) spot profiles in 40 × 40 × 40 cm3 iron and Chromalloy volumes using TOPAS with 90 and 160 MeV proton spots

Comparisons of (a) proton ranges and (b) spot profiles in 40 × 40 × 40 cm3 iron and Chromalloy volumes using TOPAS with 90 and 160 MeV proton spots