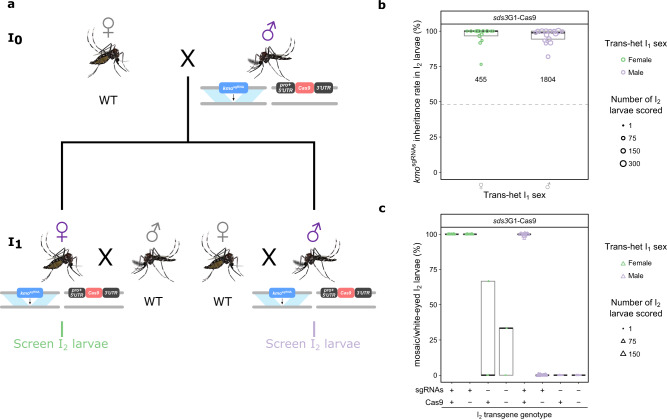
Fig. 3. Drive characteristics of individual kmosgRNAs;sds3G1-Cas9 trans-heterozygotes.
a Crossing scheme for determination of sds3G1-Cas9-induced inheritance bias. b, c Boxplots of kmosgRNAs inheritance (b) and eye phenotype (c) rates of I2 larvae. The median value is indicated by a thick black line and the maximum and minimum ends of whiskers represent the most extreme data point that is no more than 1.5 times the interquartile range. The size of each symbol is scaled to the amount of I2 progeny scored. Total number of screened larvae from each cross is presented below corresponding data points. Mosquito figures obtained from Ramirez38,39. Source data are provided as a Source data file. pro = promoter, ♂ = male, ♀ = female.

