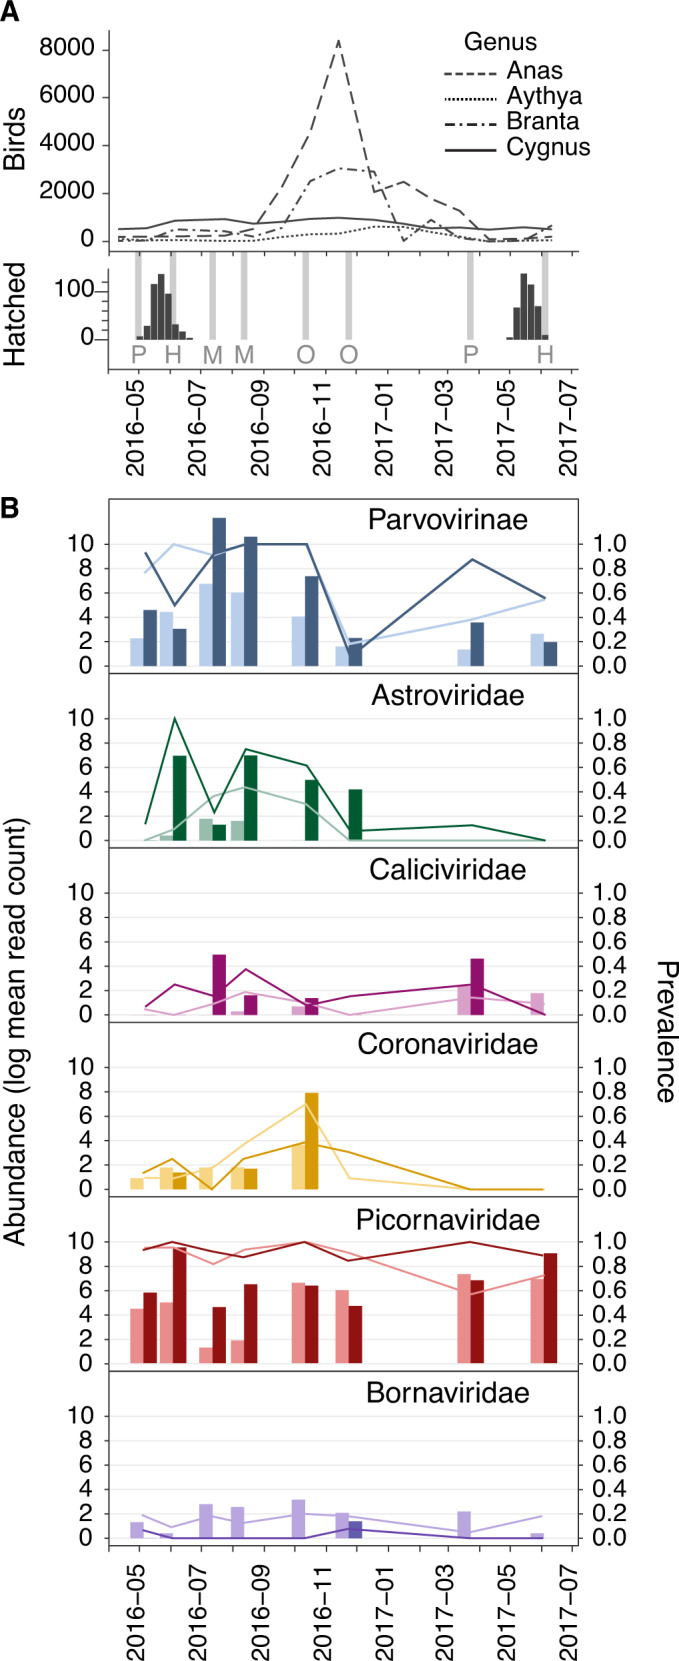
Fig. 4. Seasonal changes in viral abundance and prevalence by age.

A Avian demography over the sampling period. Upper panel: counts of the four most common genera of anseriformes (i.e., ducks, geese, swans) observed on the Fleet Lagoon during the sampling period, according to UK Wetland Bird Survey data (WeBS). Lower panel: number of cygnets hatching per week (black bars). Sampling occasions are indicated by the light grey bars, and seasonal category is marked with a letter; P = pre-hatching reproduction, H = hatching, M = moulting, O = over-winter migration. B Abundance (left y-axis, bars) and prevalence (right y-axis, lines) of putative bird-infecting virus groups of C. olor faecal microbiota. Abundance is shown as the natural log of the mean number of reads attributed to each taxon when the virus is present (i.e., calculated without considering zero count samples). Darker shades show juveniles, and lighter shades show adults.
