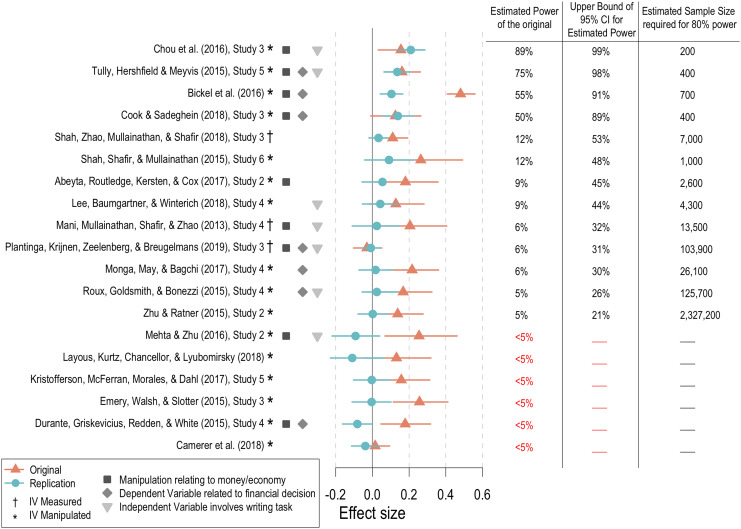
Fig. 1.
The Leftmost columns indicate common features among the replicated studies, and the Middle column depicts effect size (correlation coefficients) for the original and replication studies. Effect sizes are bounded by 95% CIs. The Right columns indicate the estimated power in the original studies (third column from the Right), the upper bound of the 95% CI for estimated power in the original (second column from the Right), and an estimated sample size required for 80% power, based on the replication effect (Rightmost column).

