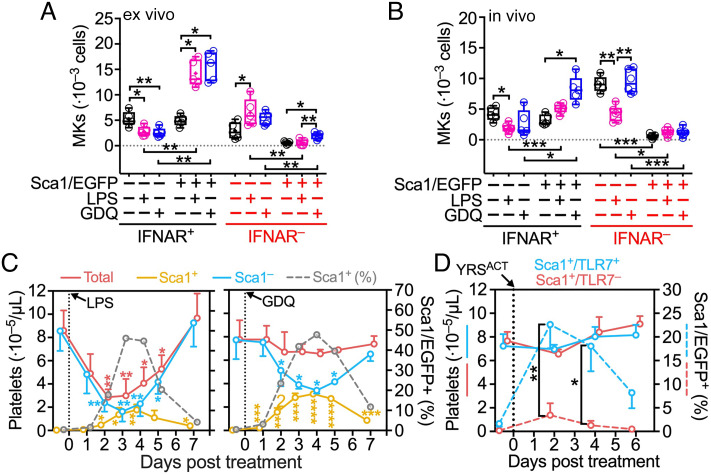
Fig. 3.
TLR4 and TLR7 activation variably inhibits normal and induces inflammatory platelet generation through IFNAR signaling. (A) Quantification of Sca1/EGFP − or + MKs in BM cells (1.5 · 107) from IFNAR + or − Sca1/EGFP Tg mice after 3 d in culture with GDQ (0.5 μg/mL), LPS (1 μg/mL), or vehicle control (CON). (B) Analysis (as in A) of BM cells harvested from the right femur of IFNAR + or − Sca1/EGFP Tg mice 2 d after intraperitoneal (i.p.) injection of GDQ (1 mg/kg) or LPS (2 mg/kg). Data in (A and B)—shown as 25th–75th percentile boxes with min-to-max-whiskers and individual values (n = 5)—were analyzed by Brown–Forsythe and Welch one-way ANOVA with Dunnett’s T3 posttest for multiple paired comparisons. (C) Platelets in blood were monitored in Sca1/EGFP Tg mice before and for 7 d after treatment with GDQ or LPS as in (B). Platelets were enumerated with a blood cell counter (Procyte Dx) and the percentage of Sca1/EGFP+ was determined by flow cytometry, from which numbers of Sca1/EGFP+ and Sca1/EGFP− platelets were calculated. Data shown as mean ± SD (n = 5 in each group) were analyzed by RM two-way ANOVA with Geisser–Greenhouse correction and Dunnett’s posttest (see Fig. 1C). (D) Total counts (solid lines) and percentage of Sca1/EGFP+ platelets (broken lines) monitored in TLR7+/+ (blue lines) or TLR7−/− (red lines) Sca1/EGFP Tg mice before and for 6 d after a single intravenous injection of YRSACT (30 mg/kg; n = 4 in each group). Data shown and analyzed as in (C), except that Šídák’s posttest was used. Only significant differences are indicated: *P <0.05, **P <0.01, ***P <0.001, ****P <0.0001.

