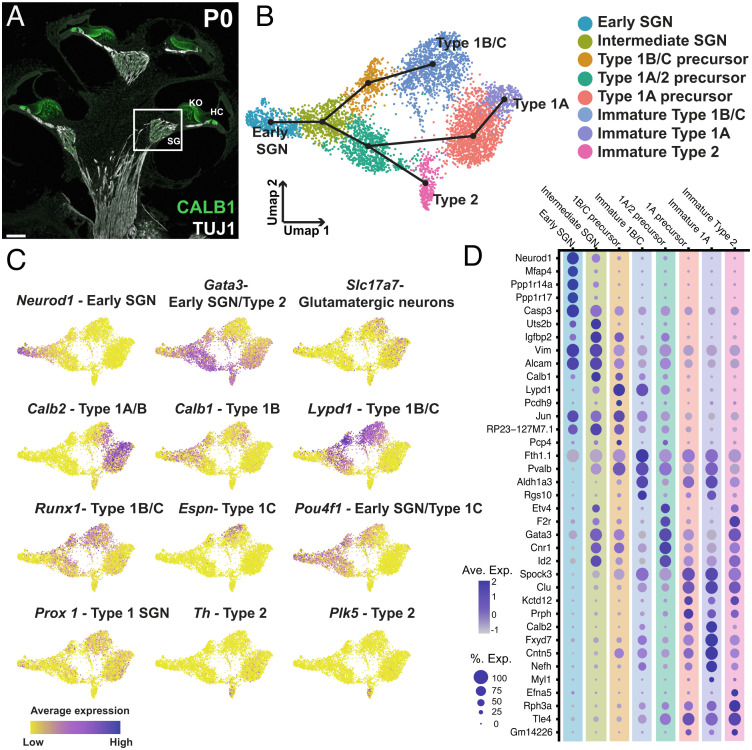
Fig. 1.
Characterization of SGN phenotypes in the combined dataset. (A) Midmodiolar cross section of a P1 cochlea with TUJ1- labeling of SGNs including their central and peripheral processes and CALB1-labeling of SGN cell bodies (SG; box), hair cells (HC), and the medial portion of Kolliker’s organ (KO). (B) UMAP of 5,441 SGNs collected at E14, E16, E18, or P1 with cluster identities indicated. Slingshot trajectory plot overlayed on the UMAP indicates order in which SGN subtypes are specified beginning in the "Early SGN" cluster. (C) Feature plots of the same data as in B, displaying gene expression levels of known markers for SGN subtypes and developmental phases across the dataset (see text for details). (D) Dot plot showing the top five differentially expressed genes for each of the clusters identified in B. (Scale bar in A, 100 µm.)

