Fig. 2.
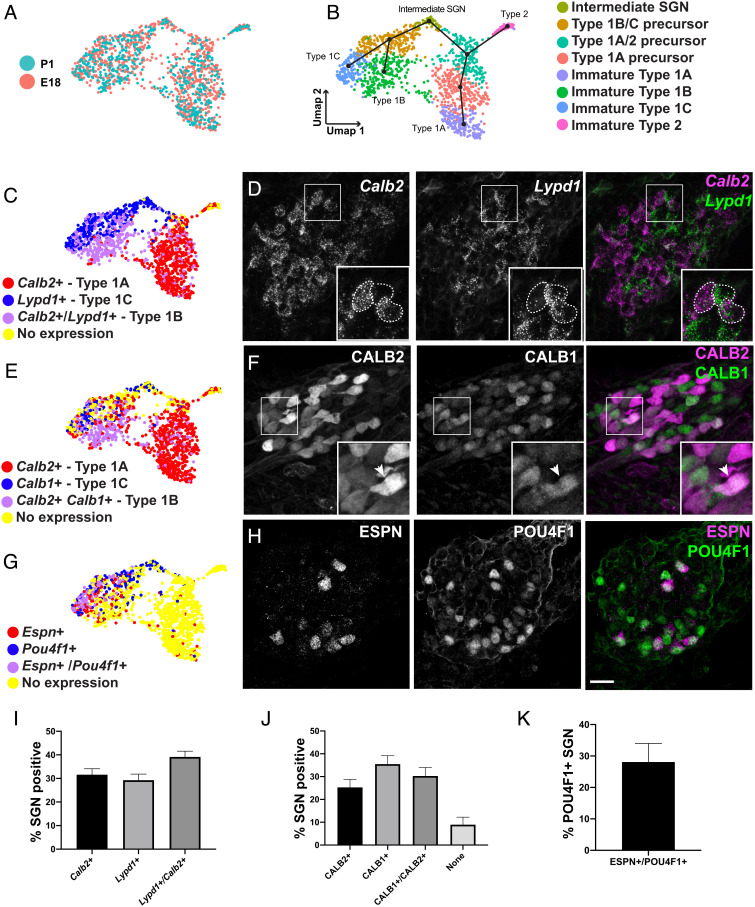
All SGN subtypes are specified by E18. (A, B) UMAP of 1,303 SGNs collected at E18 or P1 colored by time point (A) or cluster identity (B). Slingshot trajectory plot overlayed on the UMAP in B indicates order in which all four SGN subtypes are specified beginning in the "Intermediate SGN" cluster. (C, E, and G) Feature plots of the same data as in B displaying binarized gene expression of markers of Type 1 subtypes along with visualization of expression of the same markers in E18 SGN sections. (D) Fluorescent in situ hybridization confirms expression of Lypd1 and Calb2 at E18. Inset: example of three SGNs expressing either Calb2 (Type 1A) or Lypd1 (Type 1C) or both (Type 1B). (F) Immunohistochemistry confirms expression of CALB2, CALB1, or both in different SGNs at E18. Inset: arrowhead indicates a neuron expressing both markers (Type 1B). (H) Immunohistochemistry confirms expression of Type 1C markers ESPN, POU4F1, or both in a subset of SGNs at E18. (I–K) Quantification of proportion of SGNs expressing each marker above at E18. About 1/3 of SGNs express each of the three Type 1 subtypemarker combinations (I–K). Approximately 30% of POU4F1+ SGNs also express ESPN at E18. Data presented as mean ± SEM. (Scale bar in H (same in D and F), 20 µm.)

