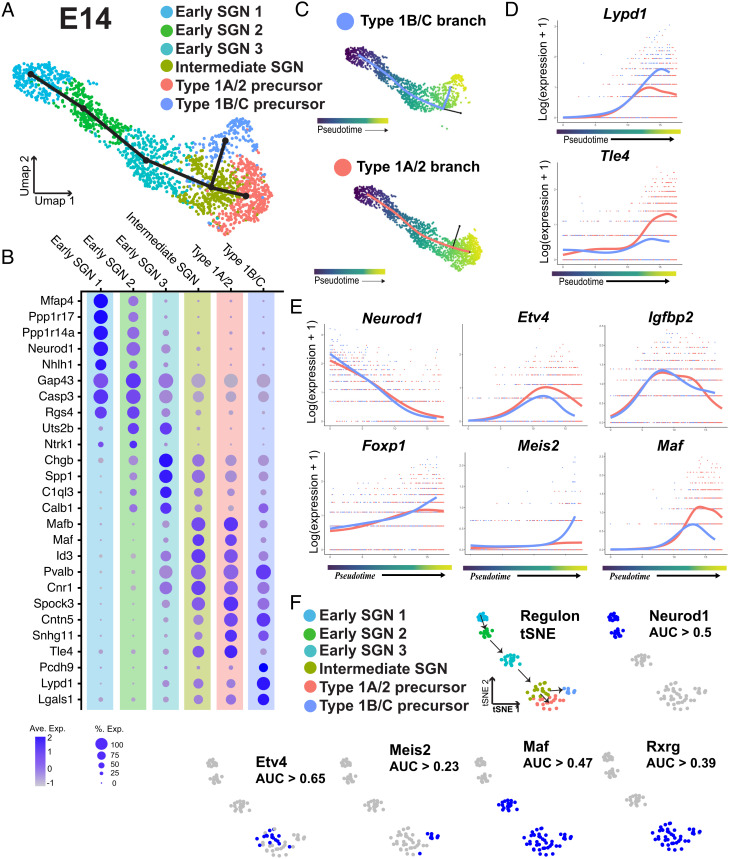
Fig. 5.
Characterization of the SGN progenitor split into Type 1B/C and Type 1A/2 branches. (A) UMAP of 1,765 SGNs collected at E14 with cluster identities indicated. Slingshot trajectory plot overlayed on the UMAP identifies a split into two branches. (B) Dot plot showing the top five differentially expressed markers for each of the clusters identified in A. (C) Pseudotime plots of the cells in each branch. (D) Expression plots of Lypd1 and Tle4 across pseudotime for each branch. Tle4 is specifically upregulated in the 1A/2 branch while Lypd1 expression is only maintained in the 1B/C branch. (E) Expression plots for transcription factors identified using tradeSeq. Top row: Etv4 and Igfbp2 are examples of transcription factors with gene expression that peaks as the two branches are splitting. Bottom row: examples of transcription factors identified as differentially expressed at the endpoints of the two branches. (F) Top row: tSNE plot based on identification of transcriptional regulons using SCENIC. Clusters are colored based on the clusters identified in A. Arrows indicate order of specification based on Slingshot analysis. Regulon tSNE plot of Neurod1 shows expected activity in early SGN clusters, blue dots indicate the regulon is active. Bottom row: examples of regulons which were both significantly restricted to specific clusters and were predicted to be active based on AUC thresholding (see Methods).

