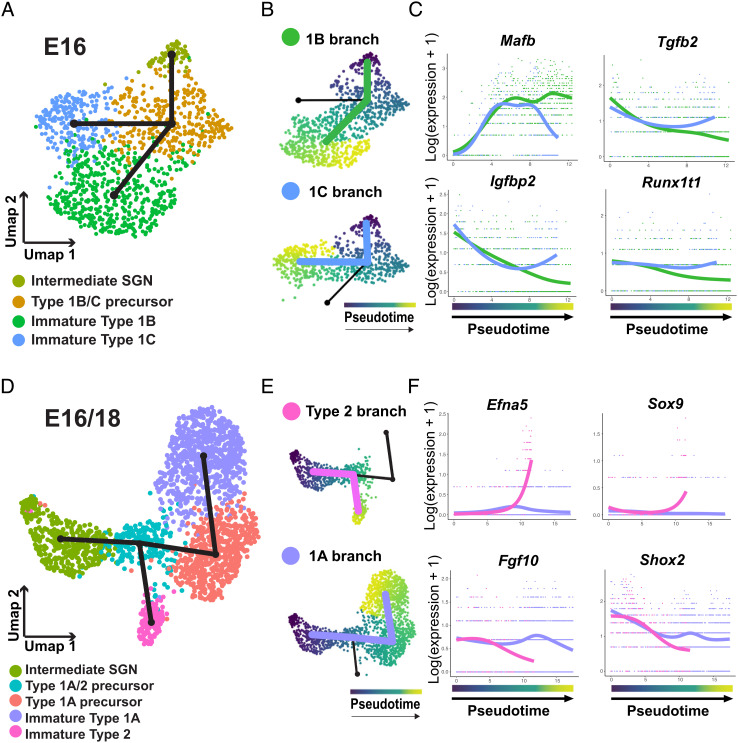
Fig. 6.
Characterization of Type 1A/2 and Type 1B/C precursor splits. (A) UMAP of 1,127 SGNs from the Type 1B/C branch collected at E16. Slingshot trajectory plot overlayed on the UMAP indicates split between Type 1B and C branches. (B) UMAP of the cells in each branch ordered in pseudotime. (C) Plots of the expression of transcription factors identified by tradeSeq analysis as differentially expressed at the endpoints of the two branches. (D) UMAP plot of 1,977 SGNs combined from the Type 1A/2 branch collected at E16 or E18. Slingshot trajectory plot overlayed on the UMAP indicates split between Type 1A and Type 2 branches. (E) UMAPs of the cells in each branch ordered in pseudotime. (F) Plots of the expression of transcription factors identified by tradeSeq analysis as differentially expressed as the two branches split and at the endpoints of the two branches.

