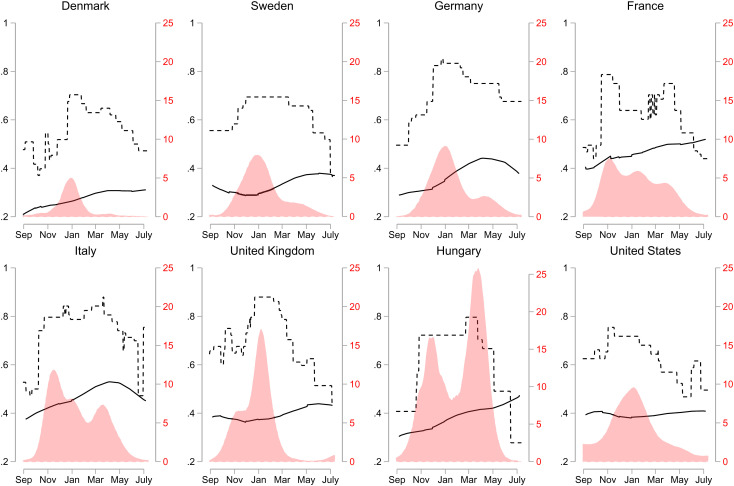
Fig. 1.
Developments in fatigue, policy stringency, and daily COVID-19 deaths (September 2020–July 2021). Solid lines are developments in fatigue based on our survey data using a lowess smoother. Dashed lines are developments in stringency of government responses to COVID-19 (based on the Oxford Stringency Index). Red areas are developments in daily COVID-19 deaths per million using a kernel smoother.

