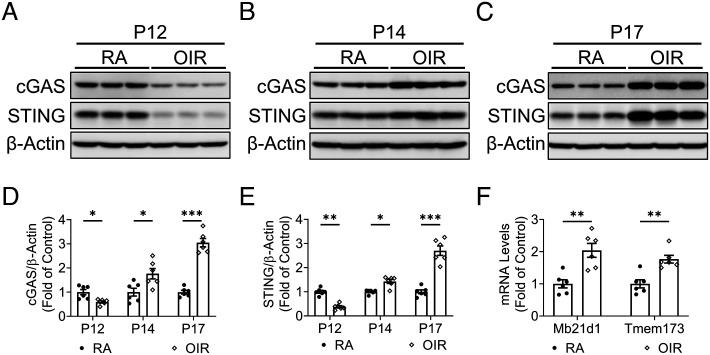
Fig. 1.
cGAS-STING signaling was up-regulated in the retinas of the OIR model. A–C: Representative western blots of cGAS and STING in the retinas of OIR mice and RA controls at P12 (A), P14 (B), and P17 (C). D and E: Protein levels of cGAS and STING in (A–C) were quantified by densitometry and normalized by β-actin levels (n = 6). F: mRNA levels of cGAS (Mb21d1) and STING (Tmem173) were measured in the retinas of OIR mice and controls at P14 (n = 6). Data were presented as mean ± SEM. *P < 0.05, **P < 0.01, ***P < 0.001.

