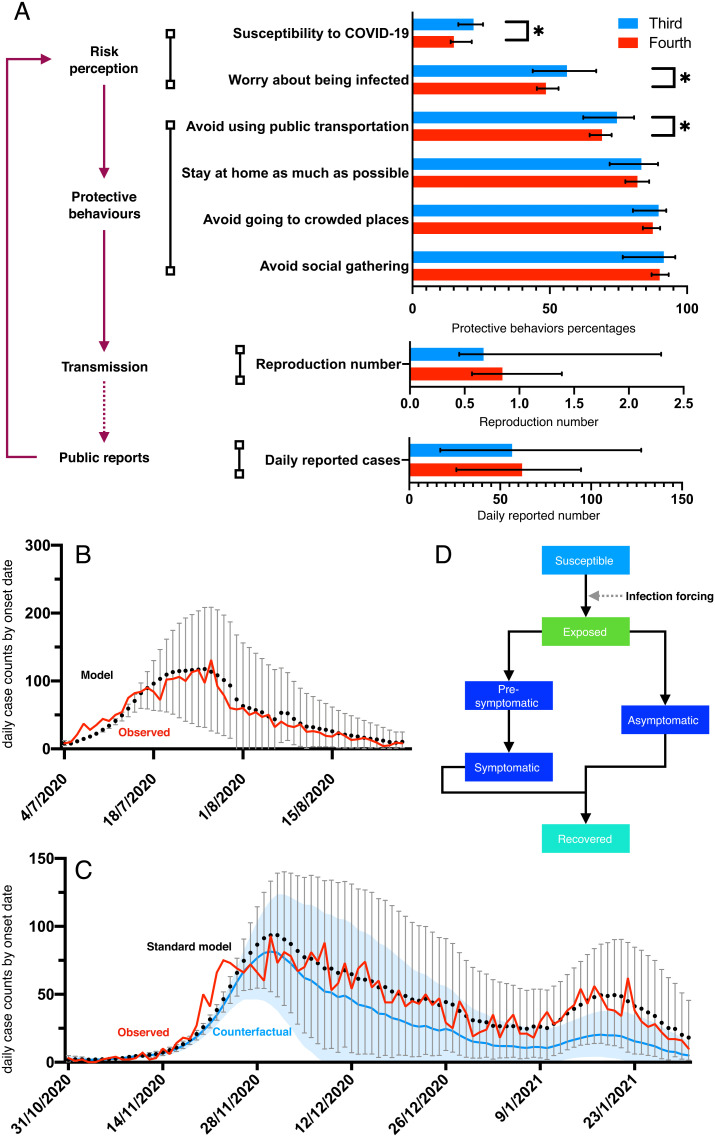
Fig. 1.
Coupled disease–behavior analysis of the risk perceptions, protective behaviors, COVID-19 transmission, and public case reports suggests the emergence of pandemic fatigue in Hong Kong’s fourth COVID-19 wave (end of October 2020 to January 2021). (A) Coupled disease–behavior framework. The Left panel indicates the interactions among risk perceptions, protective behaviors, transmission, and public case reports. The Right panel shows the percentages of participants who perceived a higher level of infection risk and who followed the guidance to take protective behaviors as estimated from our cross-sectional survey, the weekly mean reproduction numbers of SARS-CoV-2, and the number of daily reported cases for the third and fourth waves in Hong Kong. Colored horizontal bars and black error bars indicate the median and 95% credible interval (CrI), respectively. The asterisk indicates the rejection of equal medians for the third wave versus the fourth wave at the 5% significance level using the two-sided Wilcoxon rank sum test (6). (B–D) Reconstruction of the third and fourth waves of COVID-19 in Hong Kong. Using an epidemic model that incorporates the weekly survey data and Google’s real-time population mobility data, we projected the daily time series of the observed data by tracking the new symptomatic cases (SI Appendix, Epidemic Model). Red curves indicate the observed daily counts of new symptomatic cases, according to the data from the Centre for Health Protection in Hong Kong. Black dots and gray error bars indicate the median and 95% CrI of our reconstructed daily time series of new cases who developed symptoms. (B) Results for the third wave from early July to the end of August 2020. (C) Results for the fourth wave. Our standard model incorporating the transmission forcing adjusted by data of population protective behaviors (black dots and gray bars) is well fitted to the observed data (red curves) in (B) and (C), informed by the respective data in the third and fourth waves. In (C), using the fitted relationship between the transmission forcing and protective behaviors for the fourth wave, our counterfactual scenario assuming a 5% increase in the proportion of population avoiding social gathering per day (blue curve and shaded region) suggests that mitigating pandemic fatigue can substantially reduce the number of new cases after the peak of the fourth wave at around the end of November 2020. (D) Structure of the epidemic model (details in SI Appendix).

