Fig. 1.
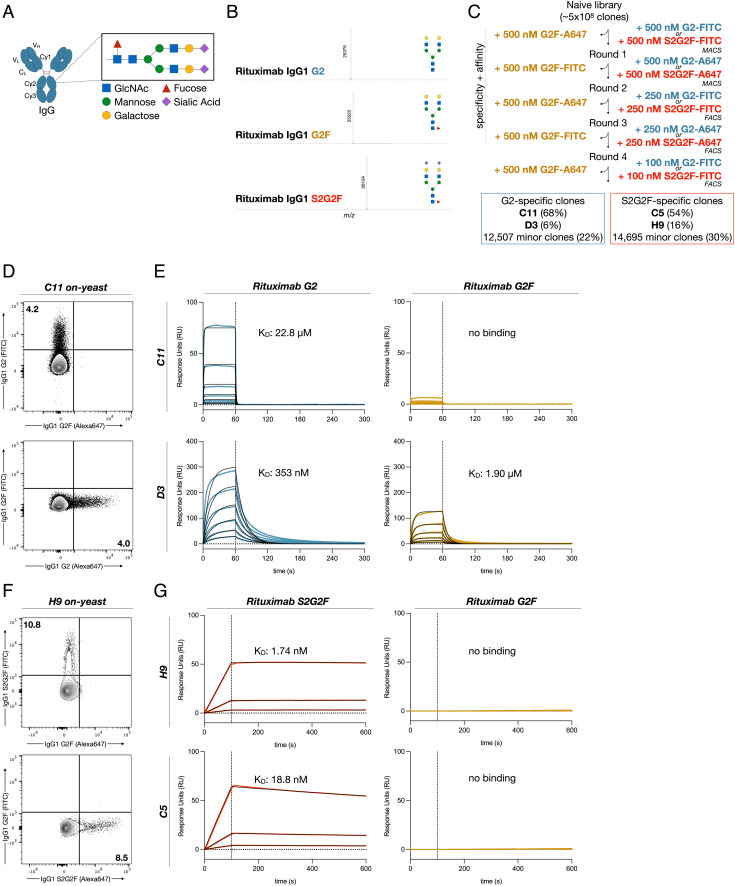
Generation of IgG glycoform-specific nanobodies. (A) Schematic of the N-linked glycan on Asn-297 of the IgG Fc. (B) Liquid chromatography electrospray ionization mass-spectrometry (LC–ESI–MS) of the G2 and G2F glycoforms of rituximab. G2-Fc, M = 25,377 Da; found (m/z) 25,376 (deconvolution data), G2F-Fc, M = 25,523 Da; found (m/z) 25,522 (deconvolution data), S2G2F-Fc, M = 26,105 Da; found (m/z) 26,104. (C) Selection strategy for identification of G2 or S2G2F glycoform-specific nanobodies via magnetic-activated cell sorting (MACS) or fluorescence-activated cell sorting (FACS). Library diversity following five rounds of selection was assessed by next generation sequencing. (D) Flow cytometry of yeast displaying C11 with fluorescently labeled IgG1 G2 and G2F glycoforms. (E) Binding kinetics of the two dominant clones specific for the G2 glycoform of IgG1 Fc, C11, and D3 evaluated by SPR. Blue or yellow traces are raw data, while 1:1 Langmuir global kinetic fits are shown in black. Sample concentrations began at 1024 nM with two-fold serial titration until 32 nM. (F) Flow cytometry of yeast displaying H9 with fluorescently labeled IgG1 G2F and S2G2F glycoforms. (G) Binding kinetics of the two dominant clones specific for IgG1 Fc S2G2F, C5, and H9. Blue or yellow traces are raw data, while global kinetic fits are shown in black. Sample concentrations began at 256 nM with four-fold serial titration until 16 nM.

