Fig. 2.
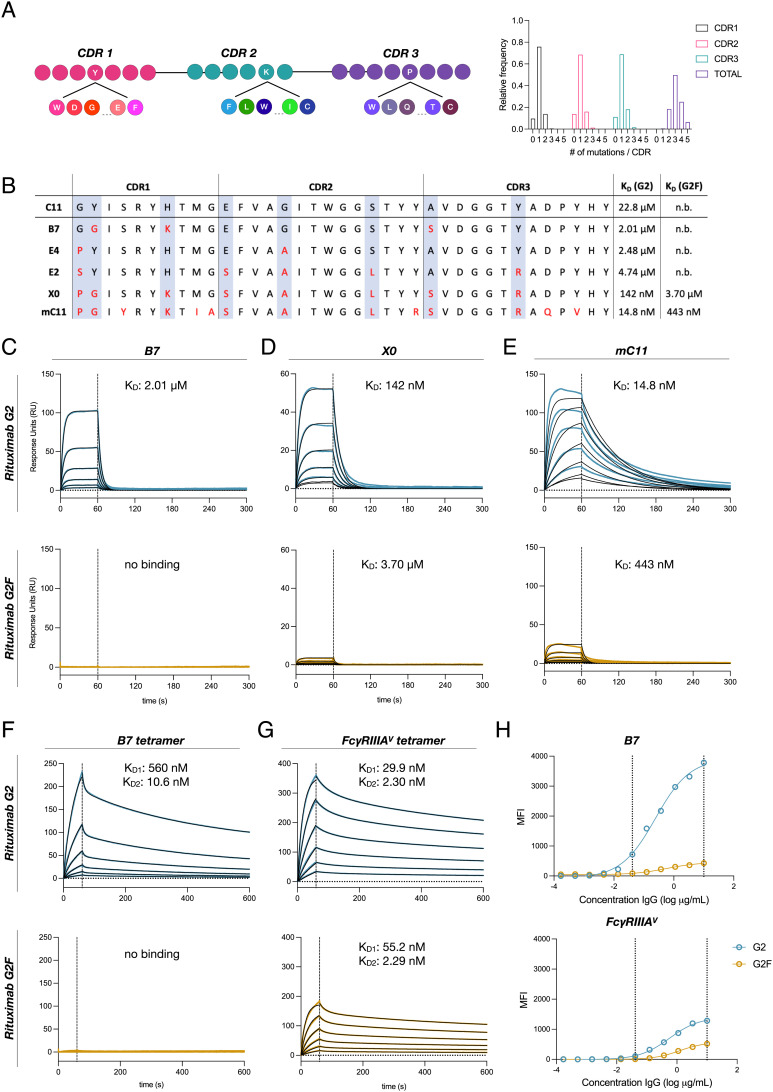
Affinity maturation of C11 yields nanobodies with nanomolar affinity. (A) Schematic representation of NNK site-saturation mutagenesis of C11’s three CDRs. High-throughput sequencing of resulting affinity maturation library demonstrates ~1 mutation per CDR for a total of ~3 per clone. (B) CDR sequences and dissociation constants (KD) for the G2 and G2F glycoforms for five afucosylation-specific high affinity clones. (C–G) Binding kinetics of B7, X0, mC11, tetrameric B7, or tetrameric FcγRIIIA with G2 or G2F glycoforms of rituximab evaluated by SPR. Blue or yellow traces are raw data, and kinetic fits are shown in black. Sample concentrations began at 256 nM with two-fold serial titration until 8 nM (H) Luminex assay comparing the specificity and sensitivity of tetrameric B7 with tetrameric FcγRIIIA for detecting the G2 or G2F glycoforms of rituximab. Vertical dashed lines indicate the range where G2 and G2F can be adequately distinguished. Data were fitted by nonlinear regression analysis.

