Fig. 1.
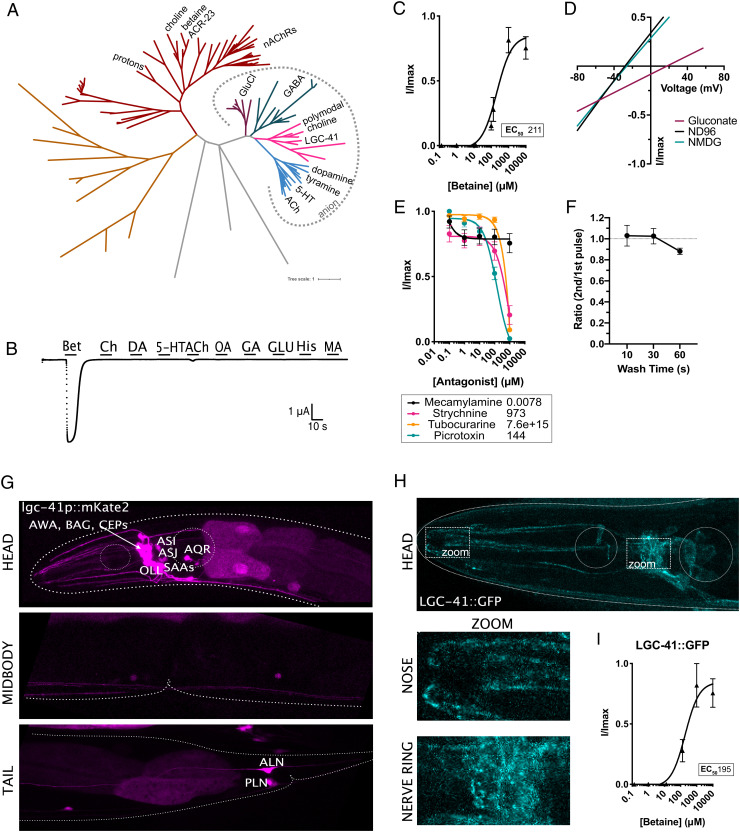
LGC-41 forms a homomeric inhibitory betaine-gated channel. (A) Phylogenetic tree showing evolutionary relationship between C. elegans LGICs, branch colors show subfamilies as follows: nAChRs (red), uncharacterized (orange and grey), GluCl (purple), GABA-gated anion and cation channels (green), diverse channels including LGC-41 (pink), ACh-gated and monoamine-gated channels (blue). Figure made with iTOL using an unrooted tree with one iteration of the equal-daylight algorithm (B) Continuous current trace for an oocyte expressing LGC-41 held at −60 mV and perfused with a panel of ligands. (C) Dose–response curve for oocytes expressing LGC-41 exposed to increasing concentrations of betaine, error bars represent SEM of at least five oocytes. Inset shows EC50 in μM calculated with a three parameter Hill slope. (D) Representative plot of current-voltage relationship of betaine-induced current in oocytes expressing LGC-41 in ND96 (Na+ & Cl− present), Na Gluconate (low Cl−) and NMDG (no Na+), mean ΔErev for ND96 vs. Na Gluconate: −43.1 mV, SEM: 0.8 mV, N = 9 oocytes. (E) Antagonist dose–response curves in oocytes expressing LGC-41 in the presence of 500 μM betaine and increasing concentrations of each antagonist, error bars represent SEM of at least seven oocytes. Inset shows IC50 in μM calculated with a three parameter Hill slope. (F) Ratio of betaine-induced current in oocytes expressing LGC-41 exposed to multiple pulses of 500 μM betaine with 10-, 30-, and 60-s wash time between pulses. Error bars represent SEM of at least 6 oocytes. (G) Fluorescent reporter of mKate2 driven under the promoter sequence of lgc-41. (H) Images of LGC-41::GFP tagged endogenously with CRISPR/Cas9 in the M3/4 loop, dotted boxes indicate zoomed areas which show localization in the nose and nerve ring. (I) Dose–response curve for oocytes expressing LGC-41::GFP exposed to increasing concentrations of betaine, error bars represent SEM of at least four oocytes. Inset shows EC50 in μM calculated with a three parameter Hill slope.

