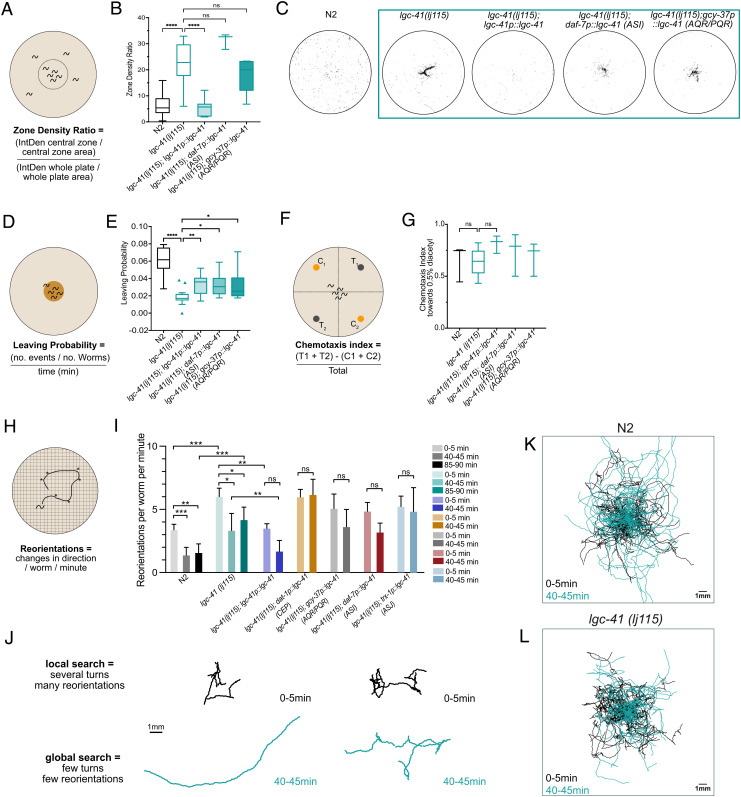
Fig. 2.
LGC-41 is required for global search and food leaving behaviors. Behavioral responses of N2 (wild-type), lgc-41(lj115)lgc-41(lj115); lgc-41p::lgc-41, lgc-41(lj115); daf-7p(ASI)::lgc-41, lgc-41(lj115); gcy-37p(AQR/PQR)::lgc-41. (A) Schematic representation of the experimental design and (B) Tukey’s box and whisker plot of dispersal assay, in which the zone density ratio of the central zone vs. the whole plate is calculated and plotted. N = 3–29 plates per genotype. (C) Representative images of threshold-filtered plates used to calculate dispersal index. (D) Schematic representation of the experimental design and (E) box and whisker plot of food leaving probability 6 h after being placed on the food patch. N = 16–21 plates per genotype. (F) Schematic representation of experiment (G) Chemotaxis index toward 0.5% diacetyl. N = 3–5 plates per genotype presented in a box and whisker plot. (H) Schematic representation of the experimental design. (I) Amount of reorientation events off food at three different time points, as measured per worm per minute. N = 99–157 per genotype. (J) Representative trajectories of individual N2 or lgc-41 mutant worms at 0–5 min and 40–45 min after removal from a food patch. (K and L) Overlaid trajectories of individual N2 or lgc-41 mutant worms at 0–5 min and 40–45 min after removal from a food patch. (K) 0–5 min: N = 95, 40–45 min: N = 85 individual worms. (L) 0–5 min: N = 58, 40–45 min: N = 52 individual worms. (B, C, E, and G) Tukey’s boxplots showing the median and one-way ANOVA with Bonferroni (B and G) or Tukey’s (C and E) correction for multiple comparisons, *P < 0.05, **P < 0.005, ****P < 0.0001. (I) Bars represent the median value with 95% CI and significance test using the Kruskal–Wallis test *P < 0.05, **P < 0.005, ***P < 0.0005.

