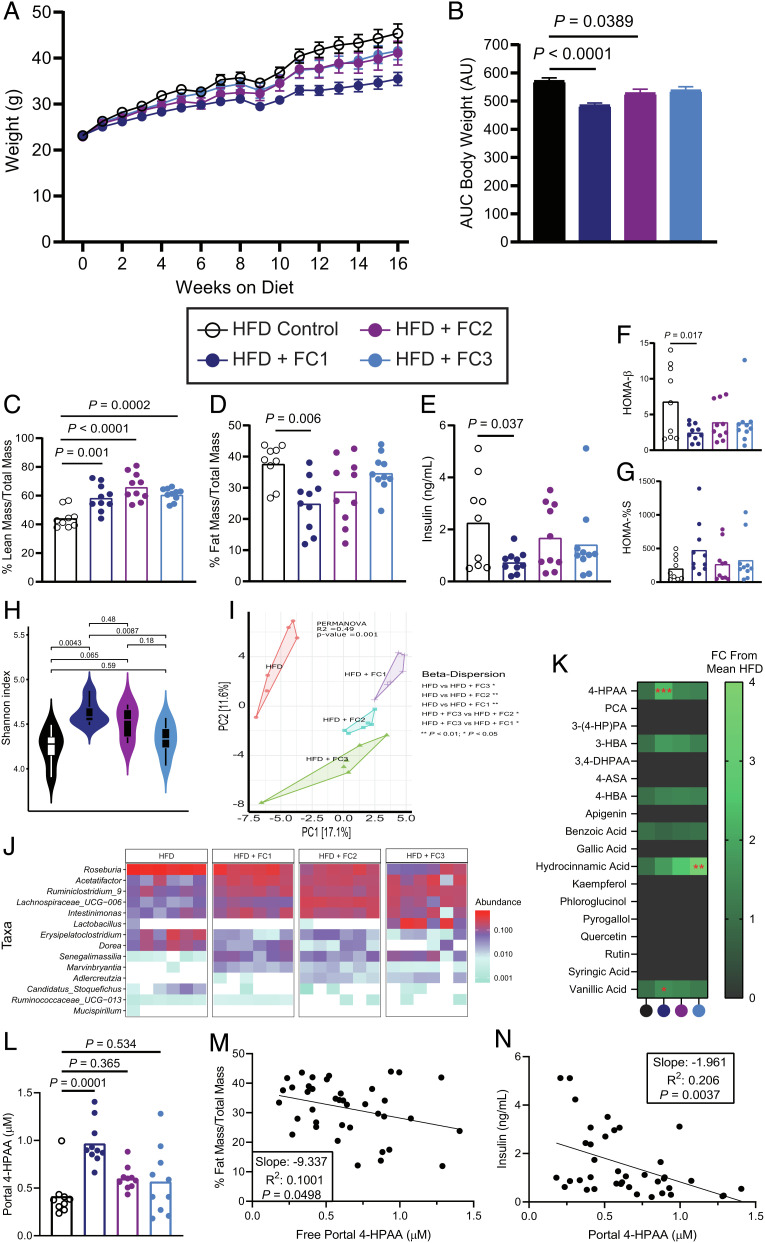
Fig. 1.
Flavonoid composites reduce HFD-induced obesity and alter the cecal microbiome. (A) Body weights of 6-wk-old male C57BL/6 mice fed a high fat control diet, or the same diet supplemented with 1% w/w FC1, FC2, or FC3 for 16 wk; n = 9–10 per group, error bars represent SEM. (B) Mean cumulative area under the curve (AUC) for body weights after 16 wk, error bars represent SEM. (C) and (D) Lean and fat mass after 16 wk as measured by EchoMRI and normalized to total body mass, n = 9–10 per group. (E) Plasma insulin after 16 wk on either control or experimental diets following a 4-h fast, n = 9–10 per group. (F) Homeostatic model assessment of β-cell function (HOMA-β), n = 9–10 per group. (G) Percent insulin sensitivity after 16 wk, n = 9–10 per group. (H) Shannon alpha diversity estimates for cecal microbiomes based on 16S rRNA profiles of all the four groups. Statistical analysis was performed via ANOVA. (I) Principal component analysis (PCA) plot based on the Bray–Curtis dissimilarity index between the cecal 16S rRNA profile of all the four groups. Statistical analysis was performed with PERMANOVA where R2 values are noted for comparisons with significant P-values and stand for percentage variance explained by the variable of interest. (J) Heatmap of the significantly differentially abundant bacterial taxa across the cecal 16S rRNA profiles of all the four groups. n = 6 for all 16S rRNA sequencing analyses. (K) Heatmap of portal plasma flavonoids and microbial flavonoid catabolites measured by LC-MS/MS, n = 9–10 per group. Statistical analysis was performed with one-way ANOVA with Tukey’s multiple comparison test. (L) Portal plasma concentration of the microbial flavonol catabolite 4-HPAA measured by LC-MS/MS. (M) Simple linear regression analysis of fat mass proportion and portal plasma 4-HPAA. (N) Simple linear regression analysis of terminal plasma insulin and portal plasma 4-HPAA. P values shown were calculated using one-way ANOVA with Dunnett’s multiple comparisons test; n = 9–10 per group. Individual points represent individual mice, and bars represent group means.

