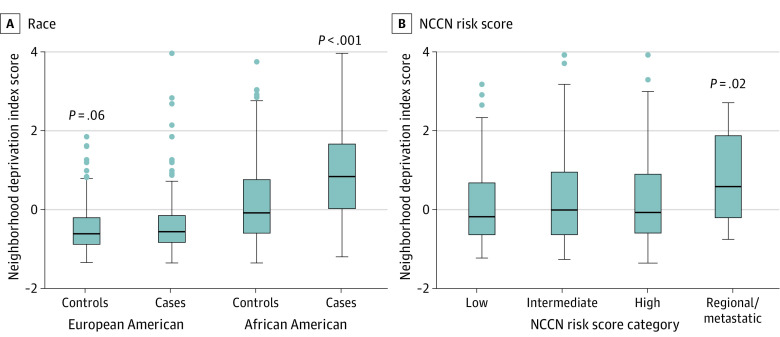
Figure 1. Association of Neighborhood Socioeconomic Deprivation With Prostate Cancer and National Comprehensive Cancer Network (NCCN) Risk Score Categories.
Neighborhood Deprivation Index scores shown as continuous data for controls and cases (A) and 4 NCCN risk score categories (low to high scores define localized disease) defining the clinical presentation of prostate cancer (B). The error bars represent the 95% CI. Mann-Whitney (A) and Kruskal-Wallis (B) tests were applied for significance testing.

