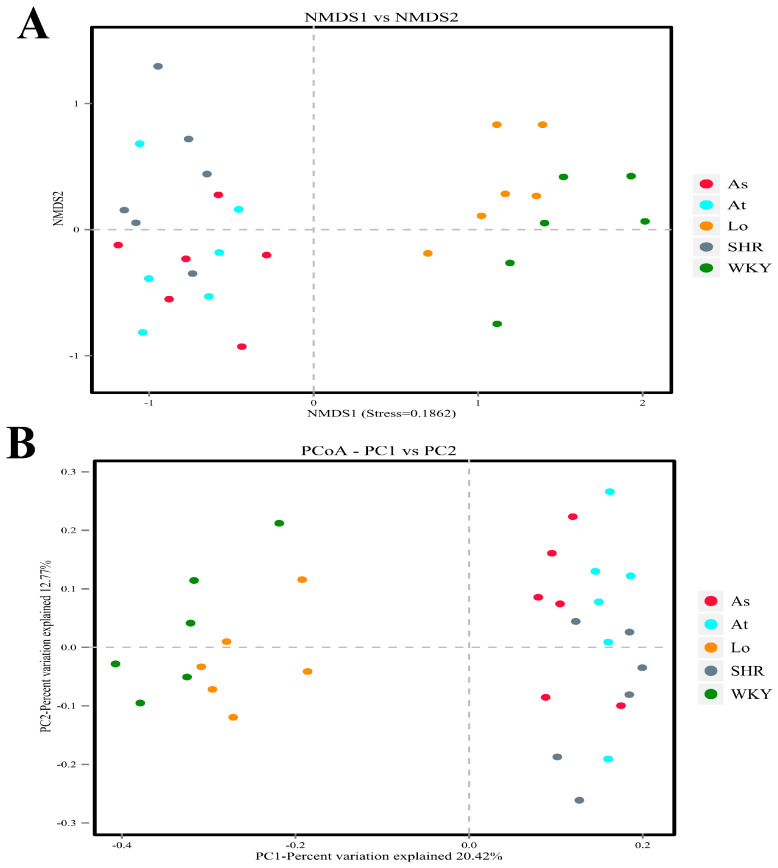
Figure 5.
Beta diversity analysis. (A) Nonmetric multidimensional scaling (NMDS) is used to compare the differences between sample groups. Each point in the diagram represents a sample. The closer the distance is between the two points, the smaller the difference in the composition of the gut microbiota is. (B) Principal co-ordinates analysis (PCoA) was used to investigate the community similarity of gut microbiota. The closer the distance is between the two points, the higher the similarity in the composition of the gut microbiota is.

